Loading
Loading

The first step to using Power BI in any meaningful way is to add data. However, we knew that this can be a painful process for many users, particularly new or less-technical users. We have an incredibly powerful data prep tool and all this power can be overwhelming and inaccessible to users.
The various entry points and methods for importing data into Power BI can make it challenging for new users to onboard and navigate this tool.
What is Power BI?Users cannot always find the data source they’re looking for because of bad categorization or bad naming or not sure where to go to select a right type.
In this chart you can see out of 1.07 Million Power BI launches, about 49% of our users that launched Power BI, drop off because it's too complicated and cumbersome to even try bring their data into our app. This is very bad! We need to fix this.
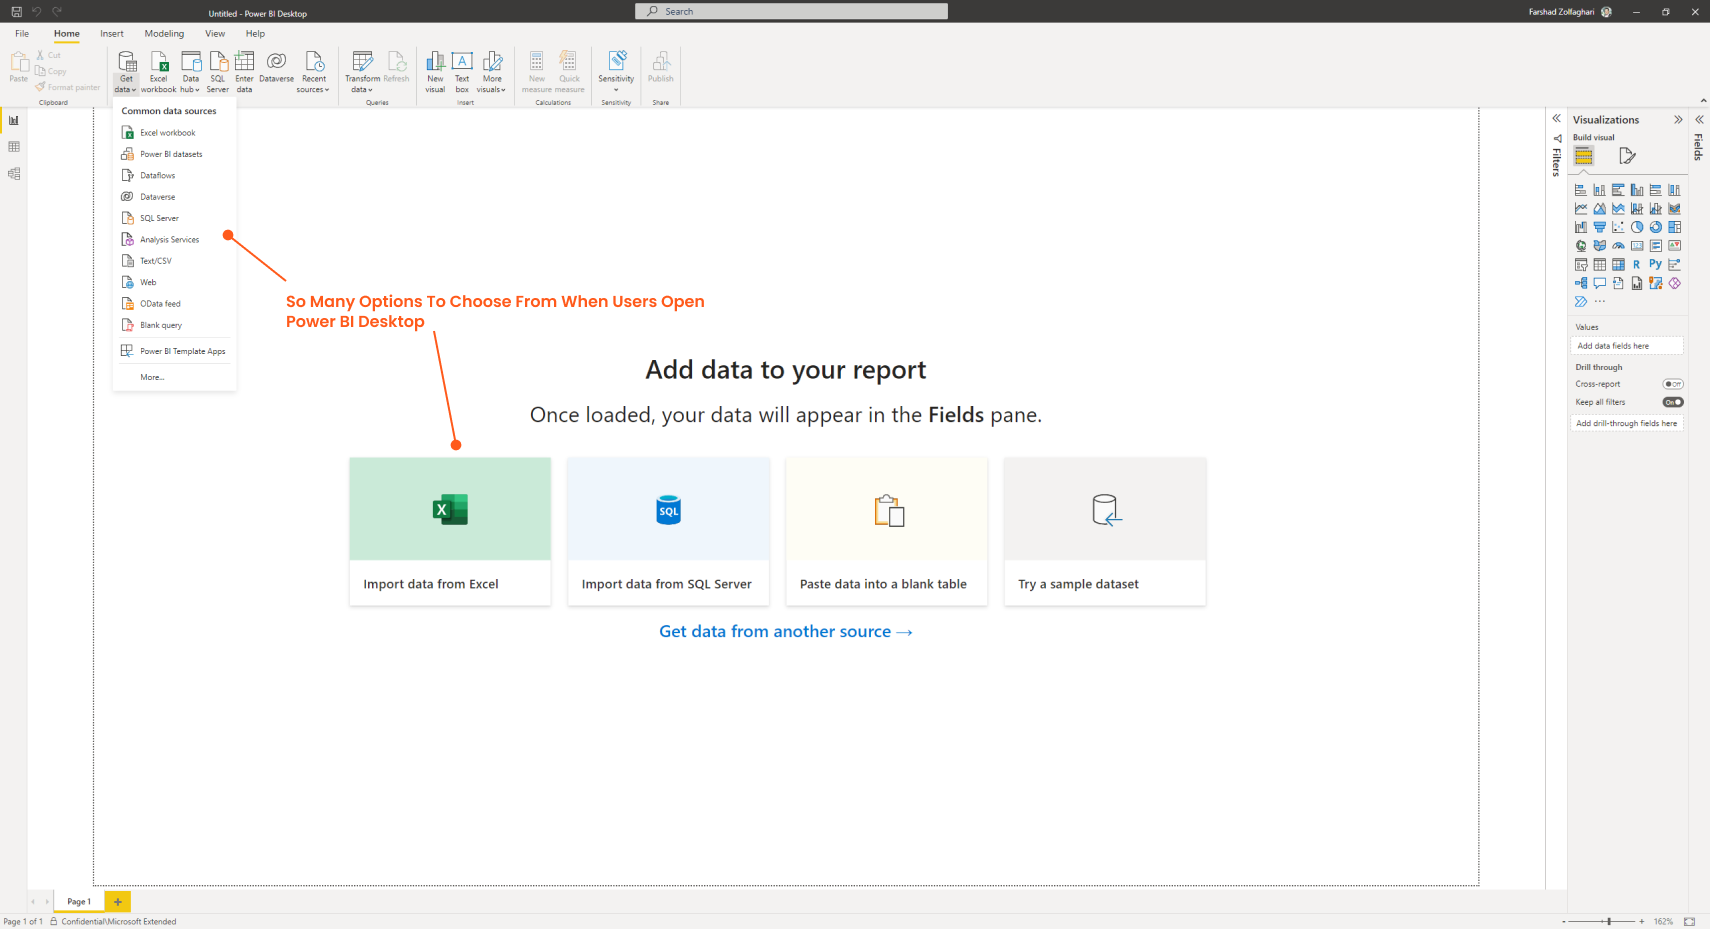
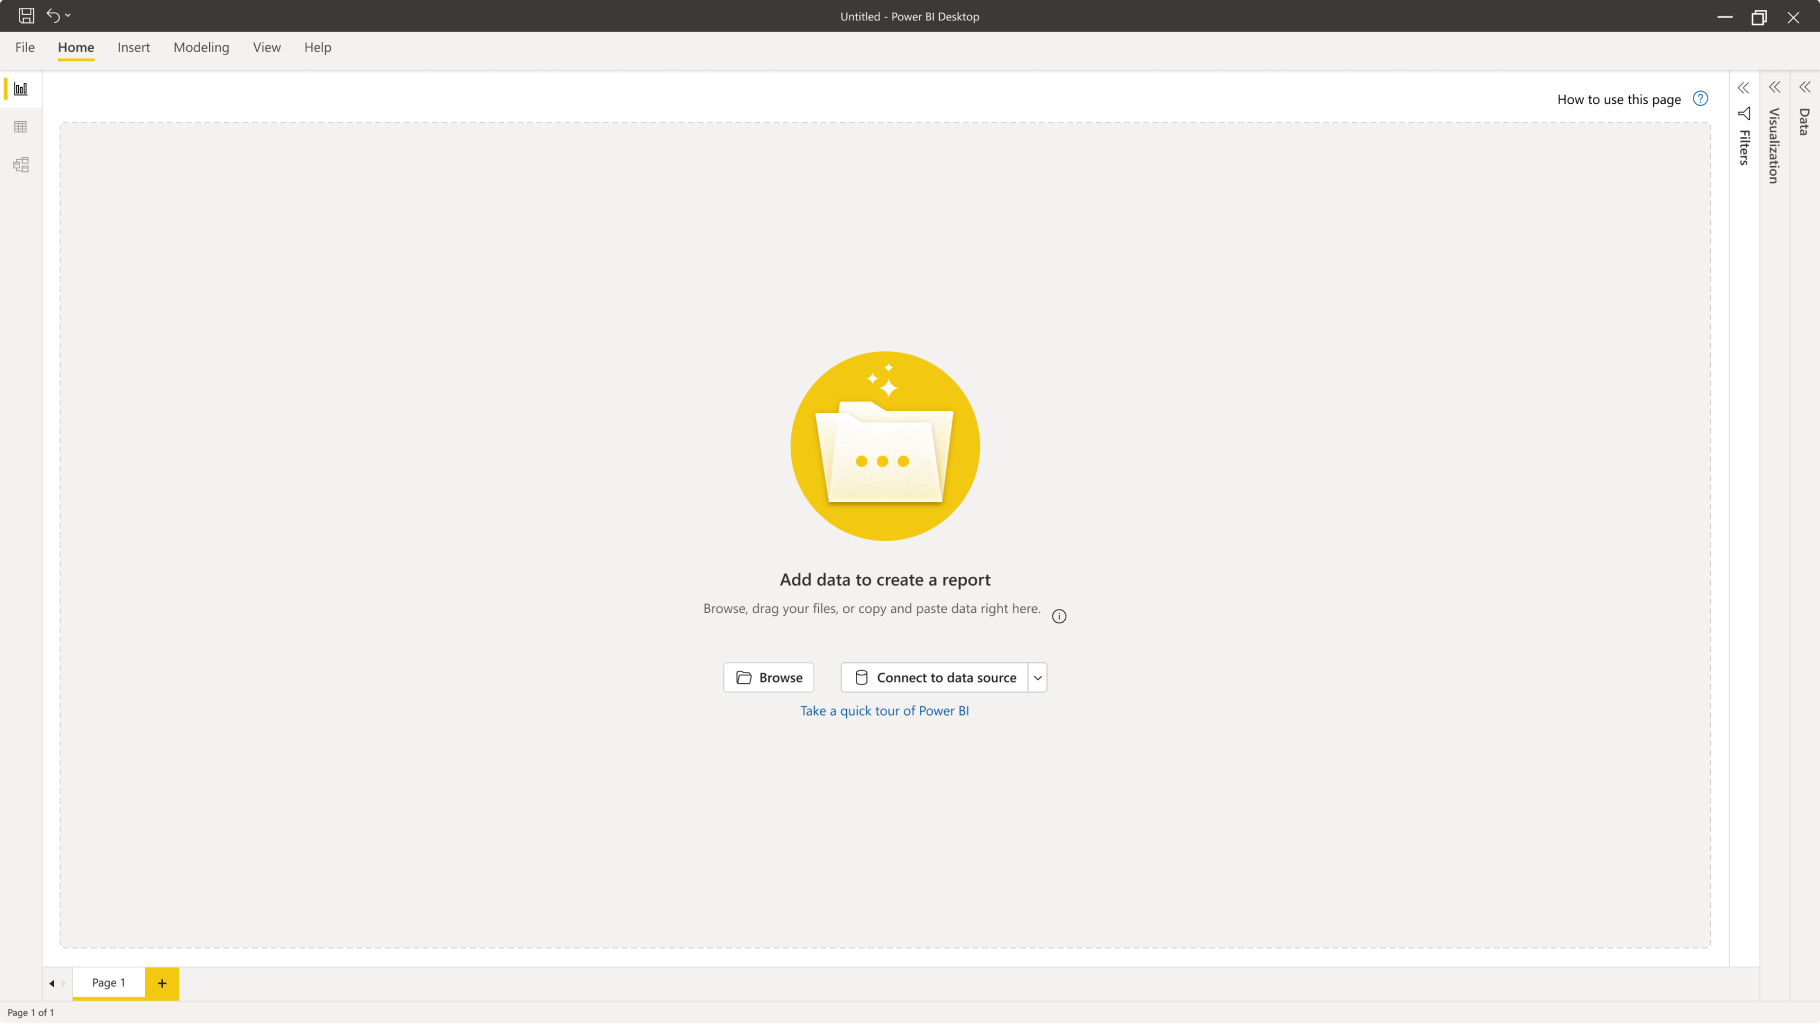
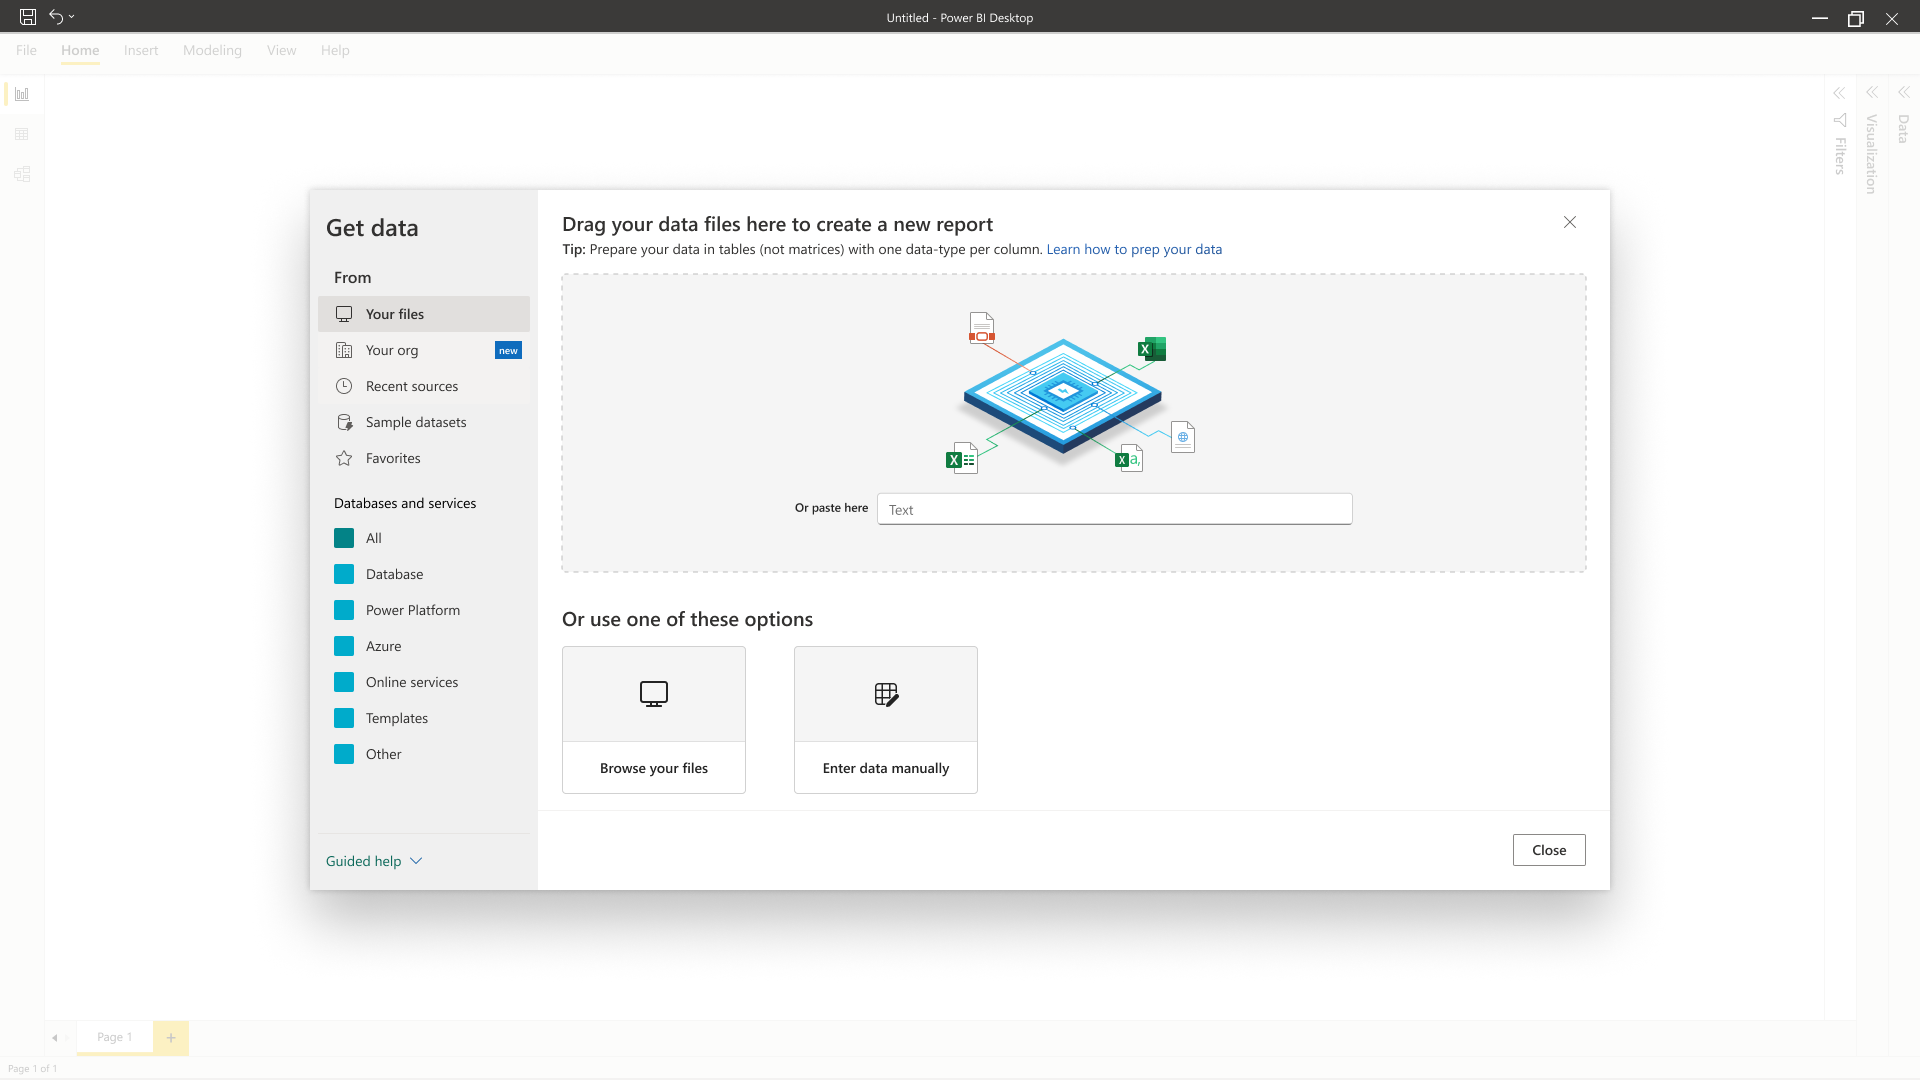
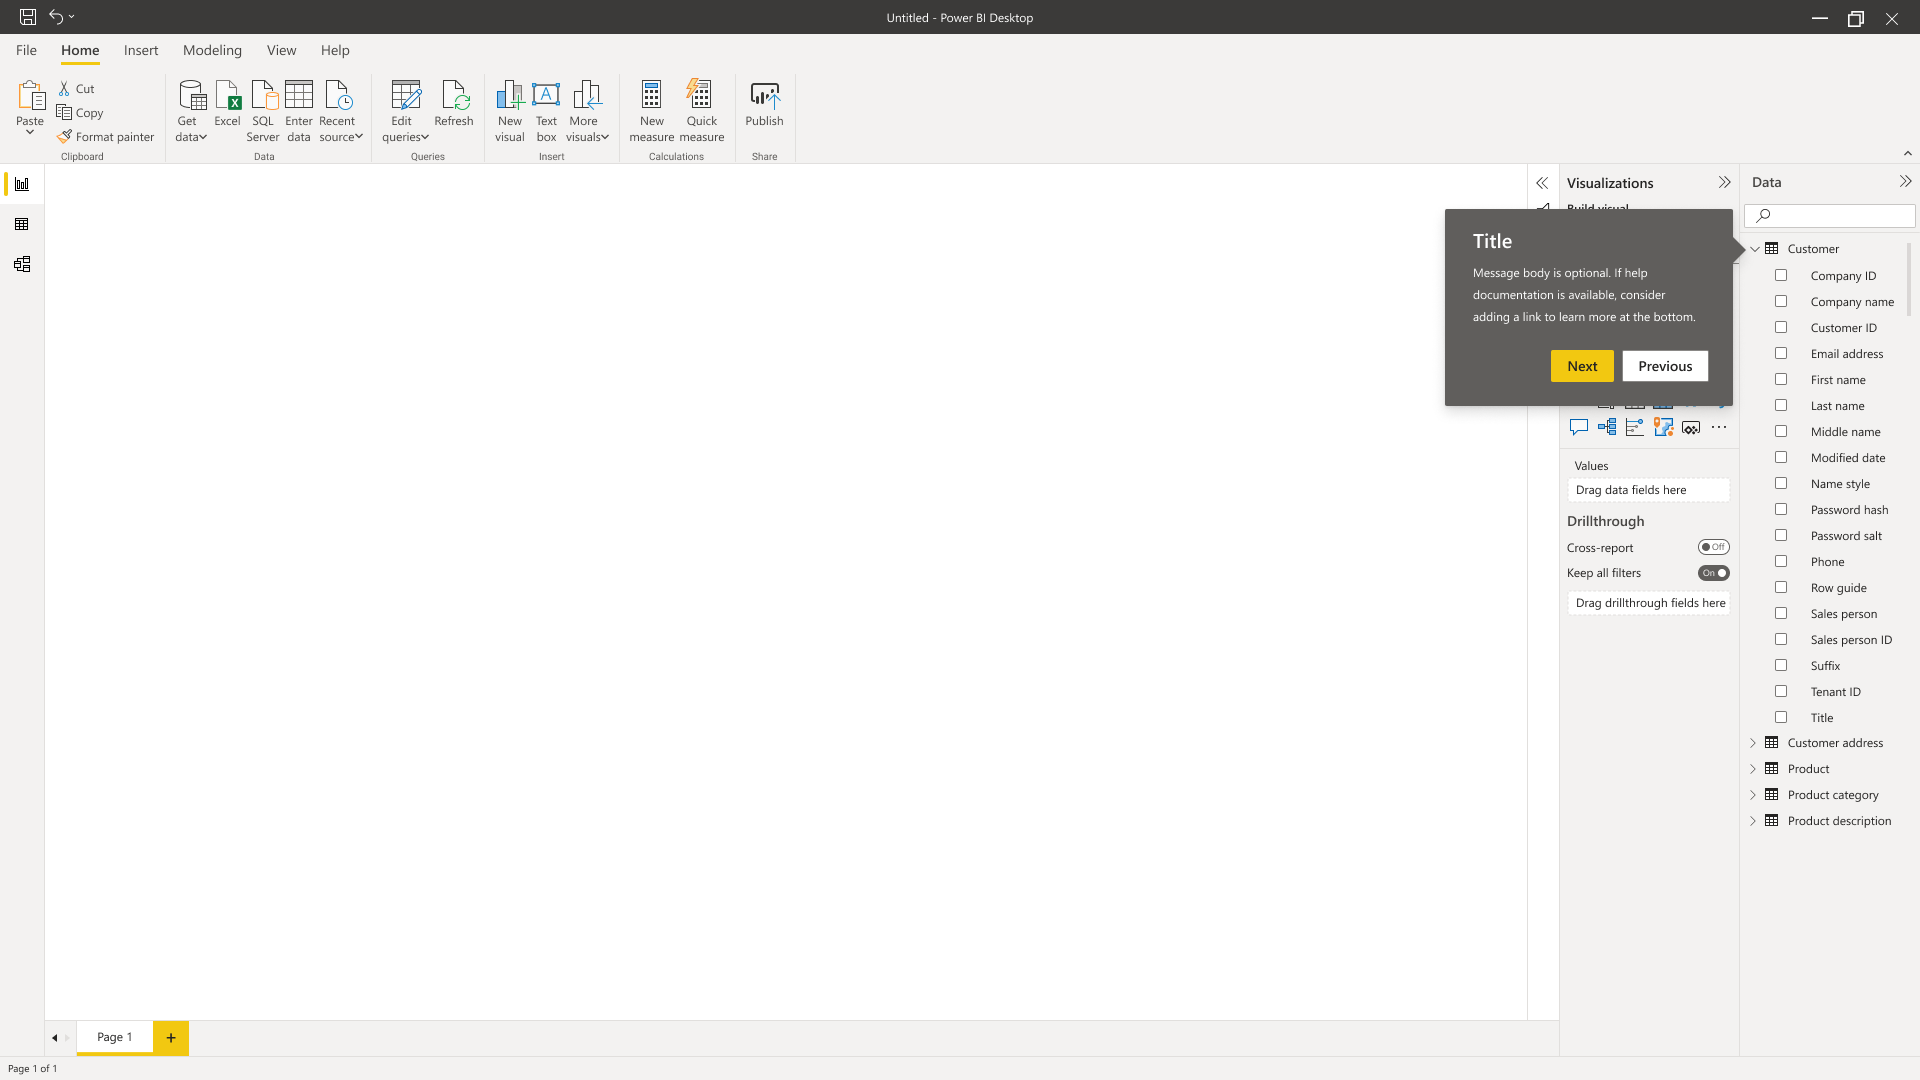
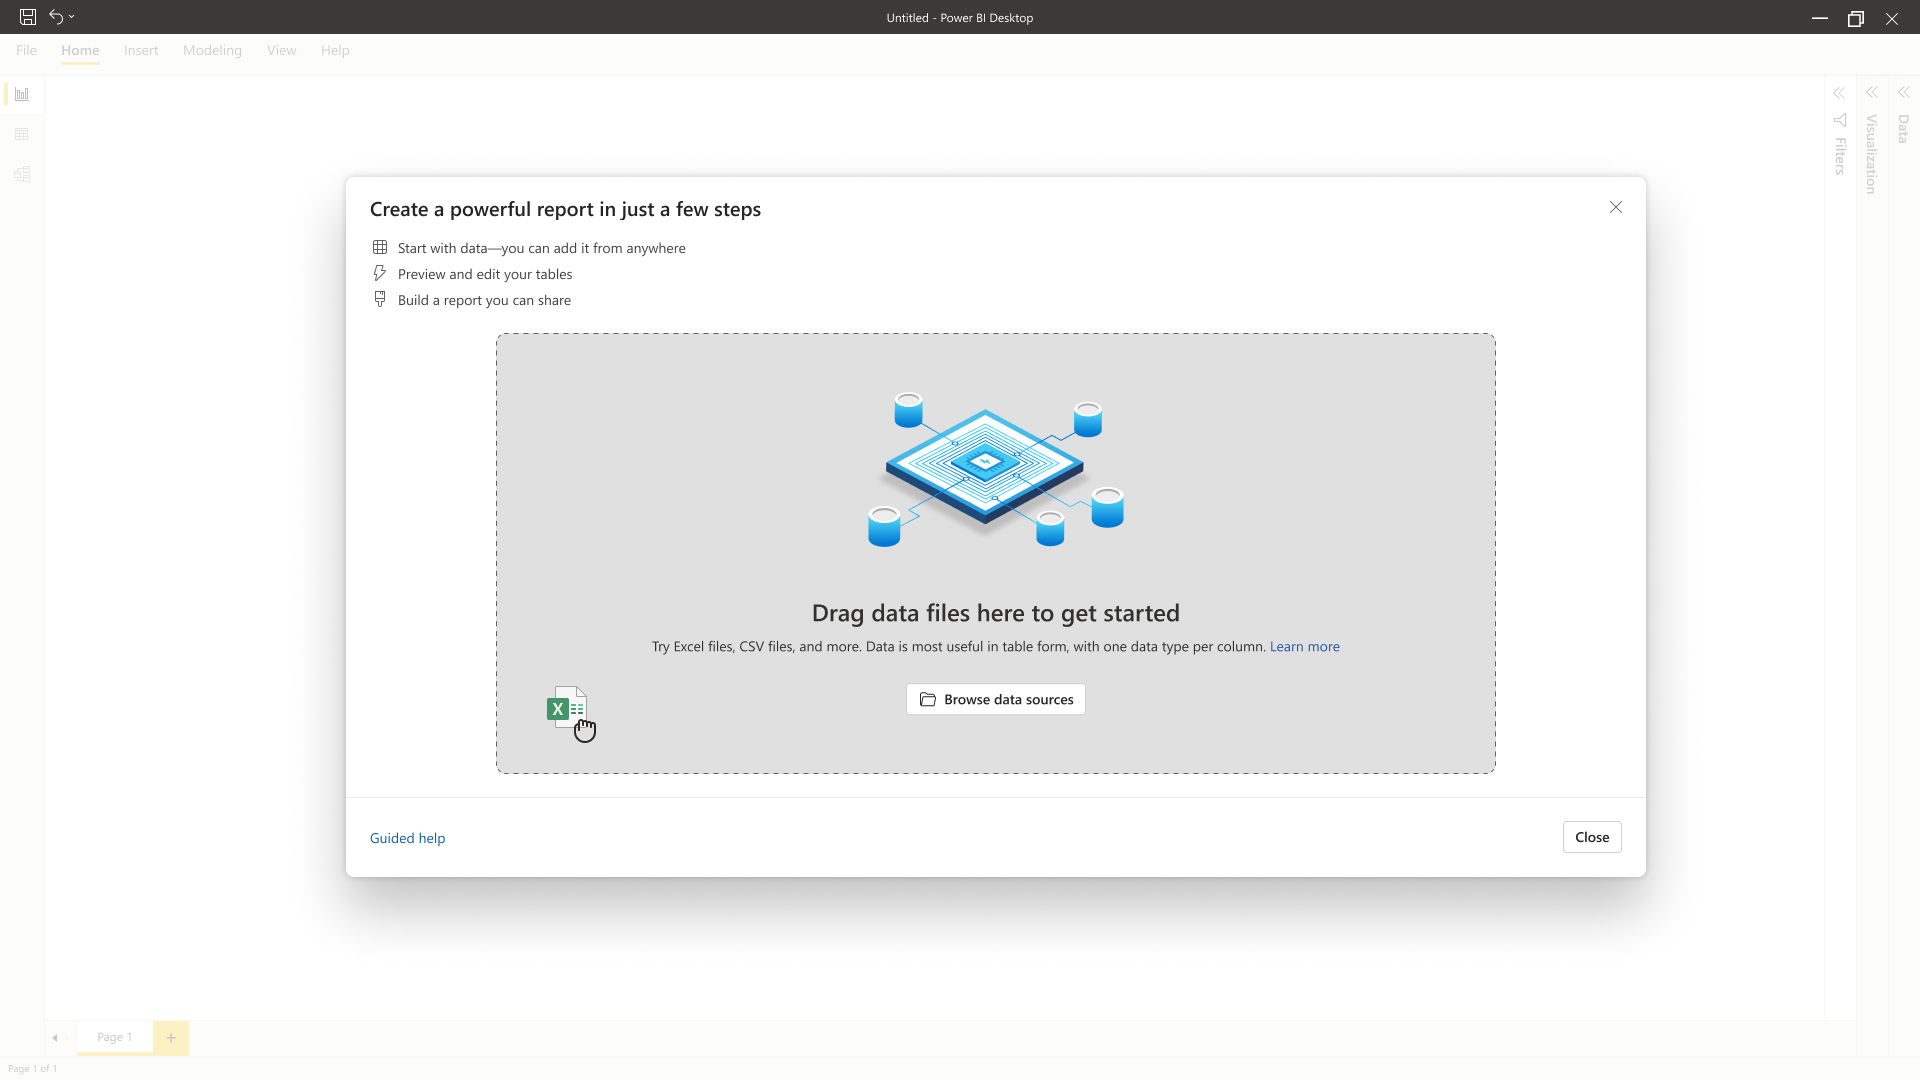
When users open Power BI for first time they land on a blank canvas with couple of options. The first step is to bring some data in Power BI app. Here is where 49% of our users drop off.
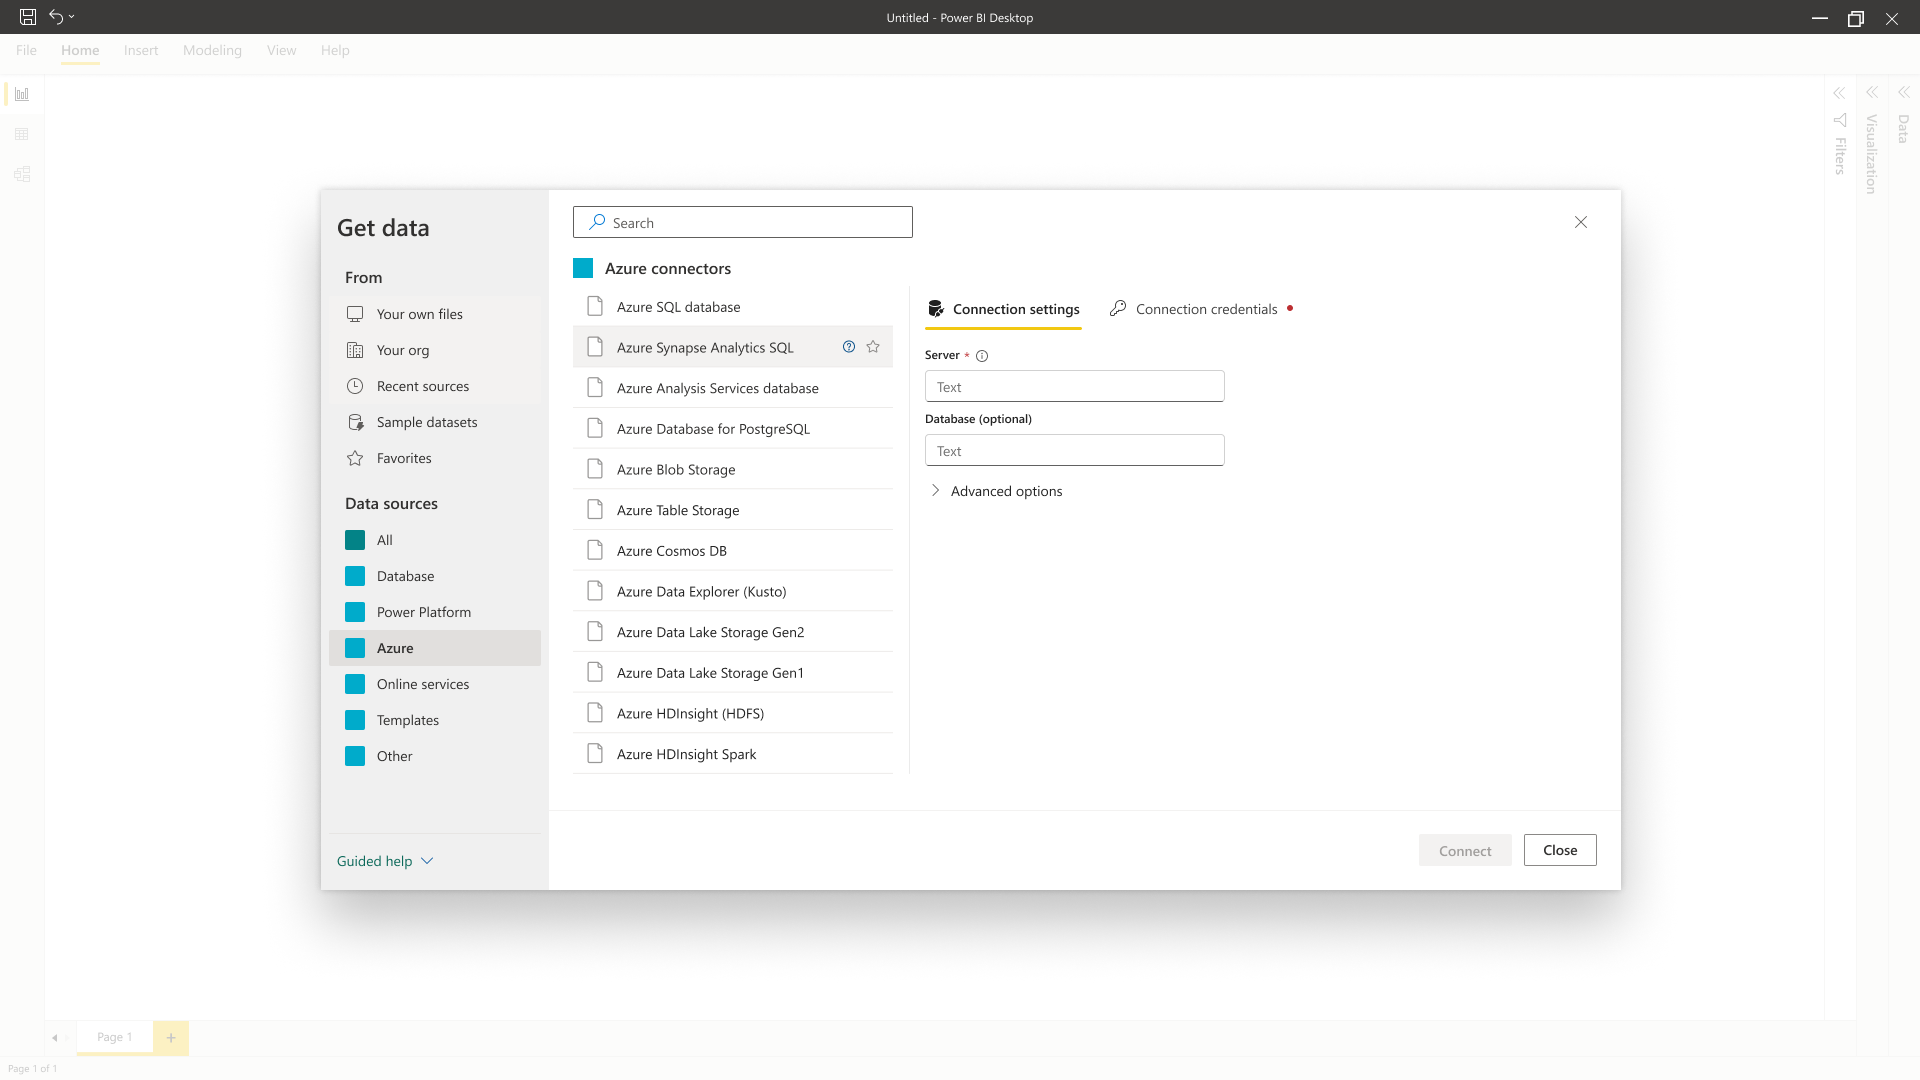
The problem is that these options are super unclear for our users specifically new ones, it's not designed to make the job done and doesn't provide any info about what would be the next step and which option is the right one to pick.
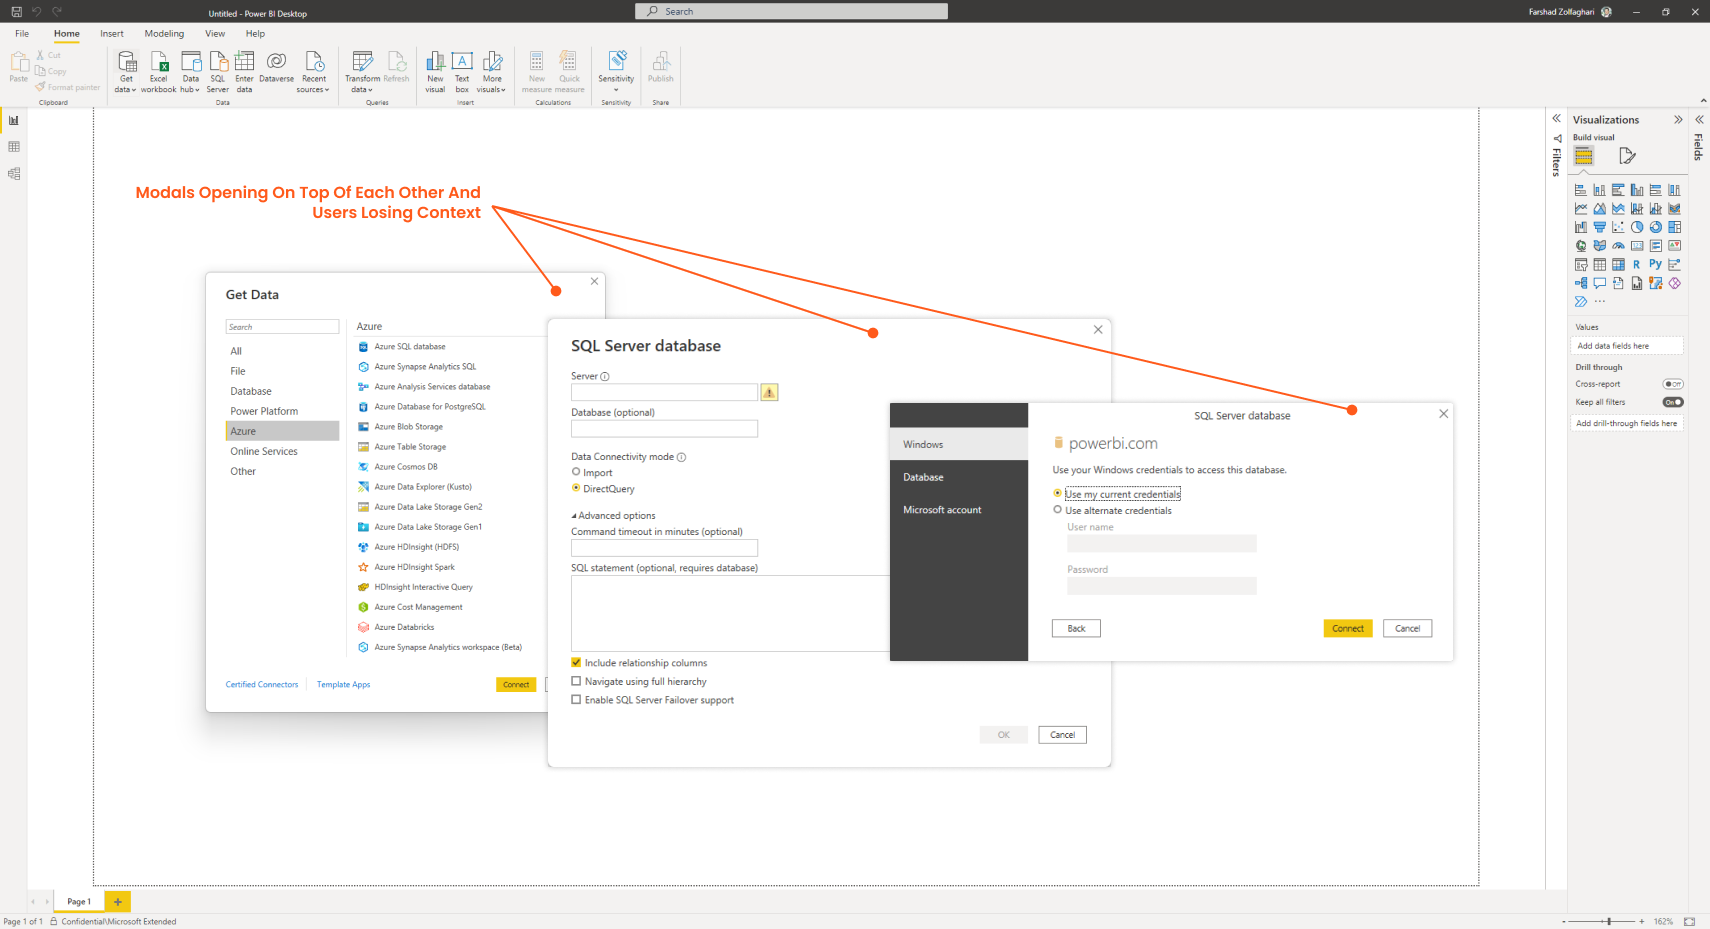
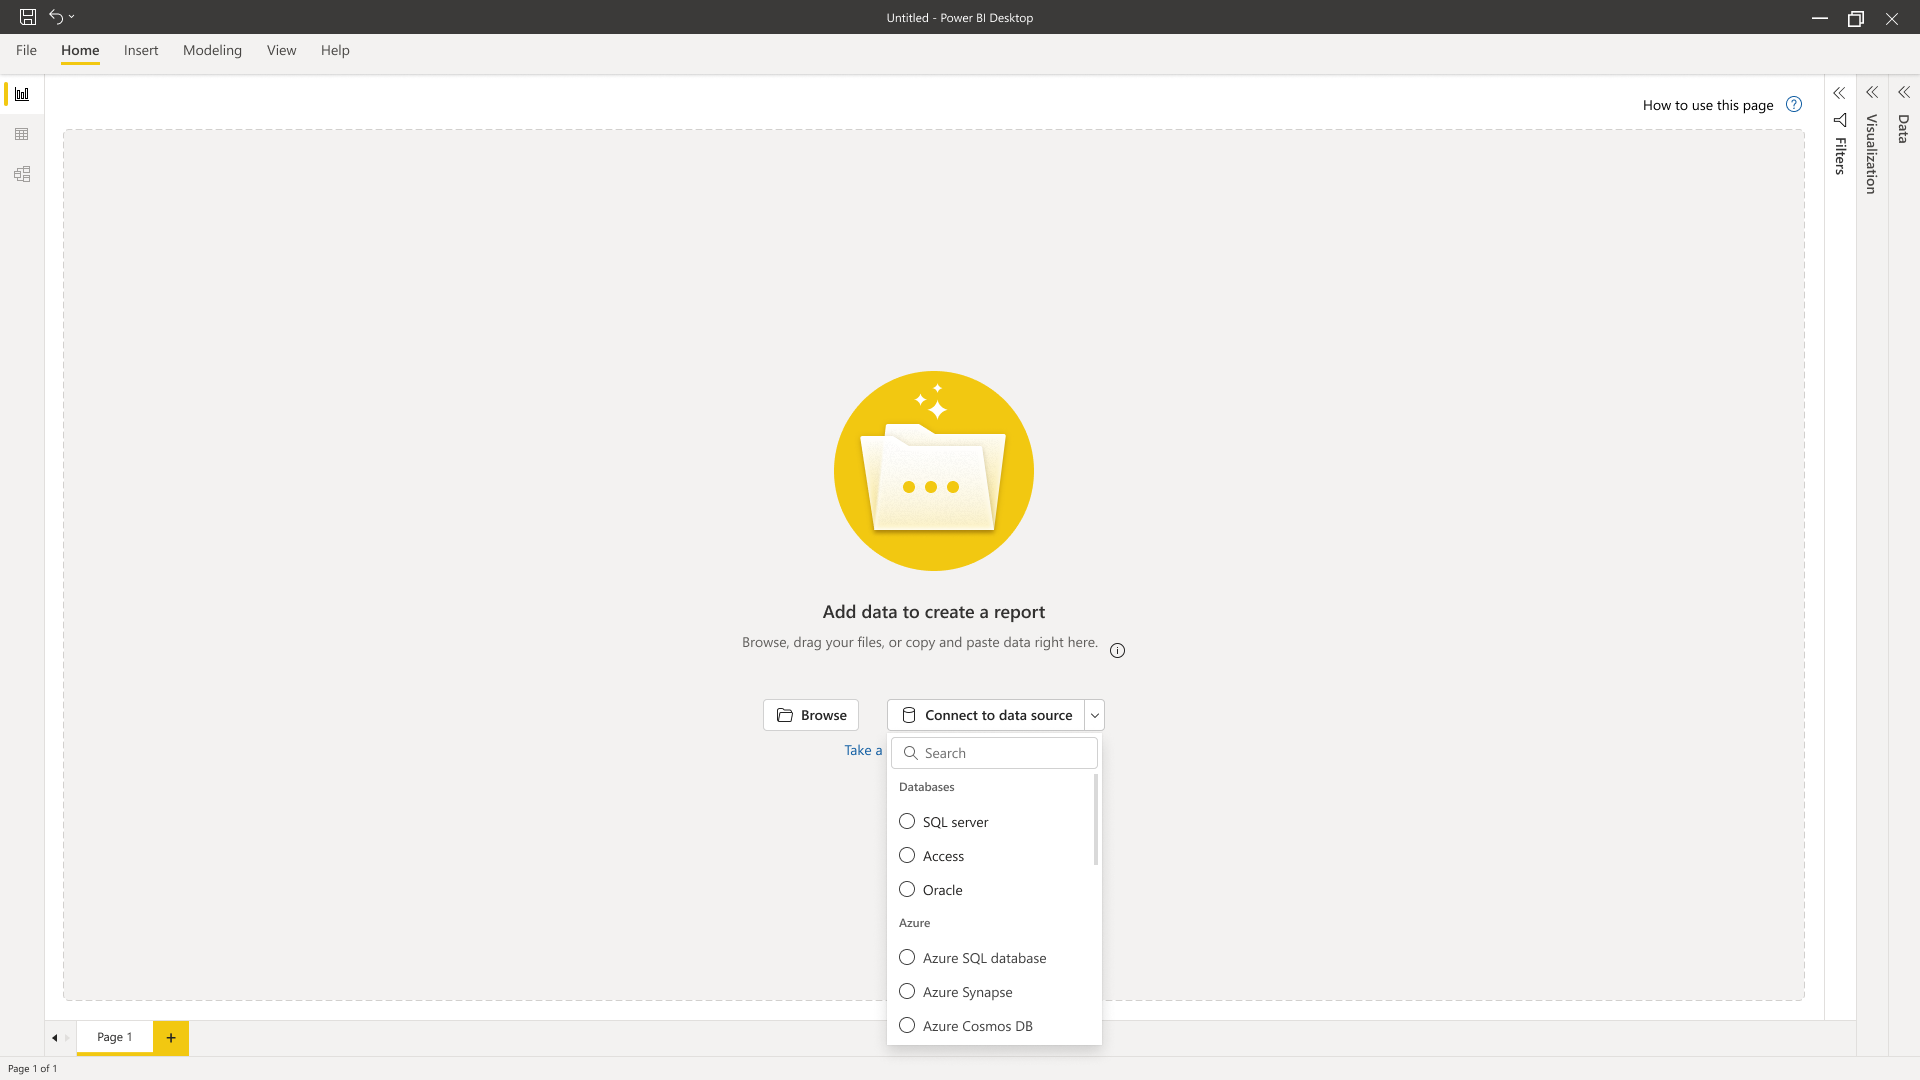
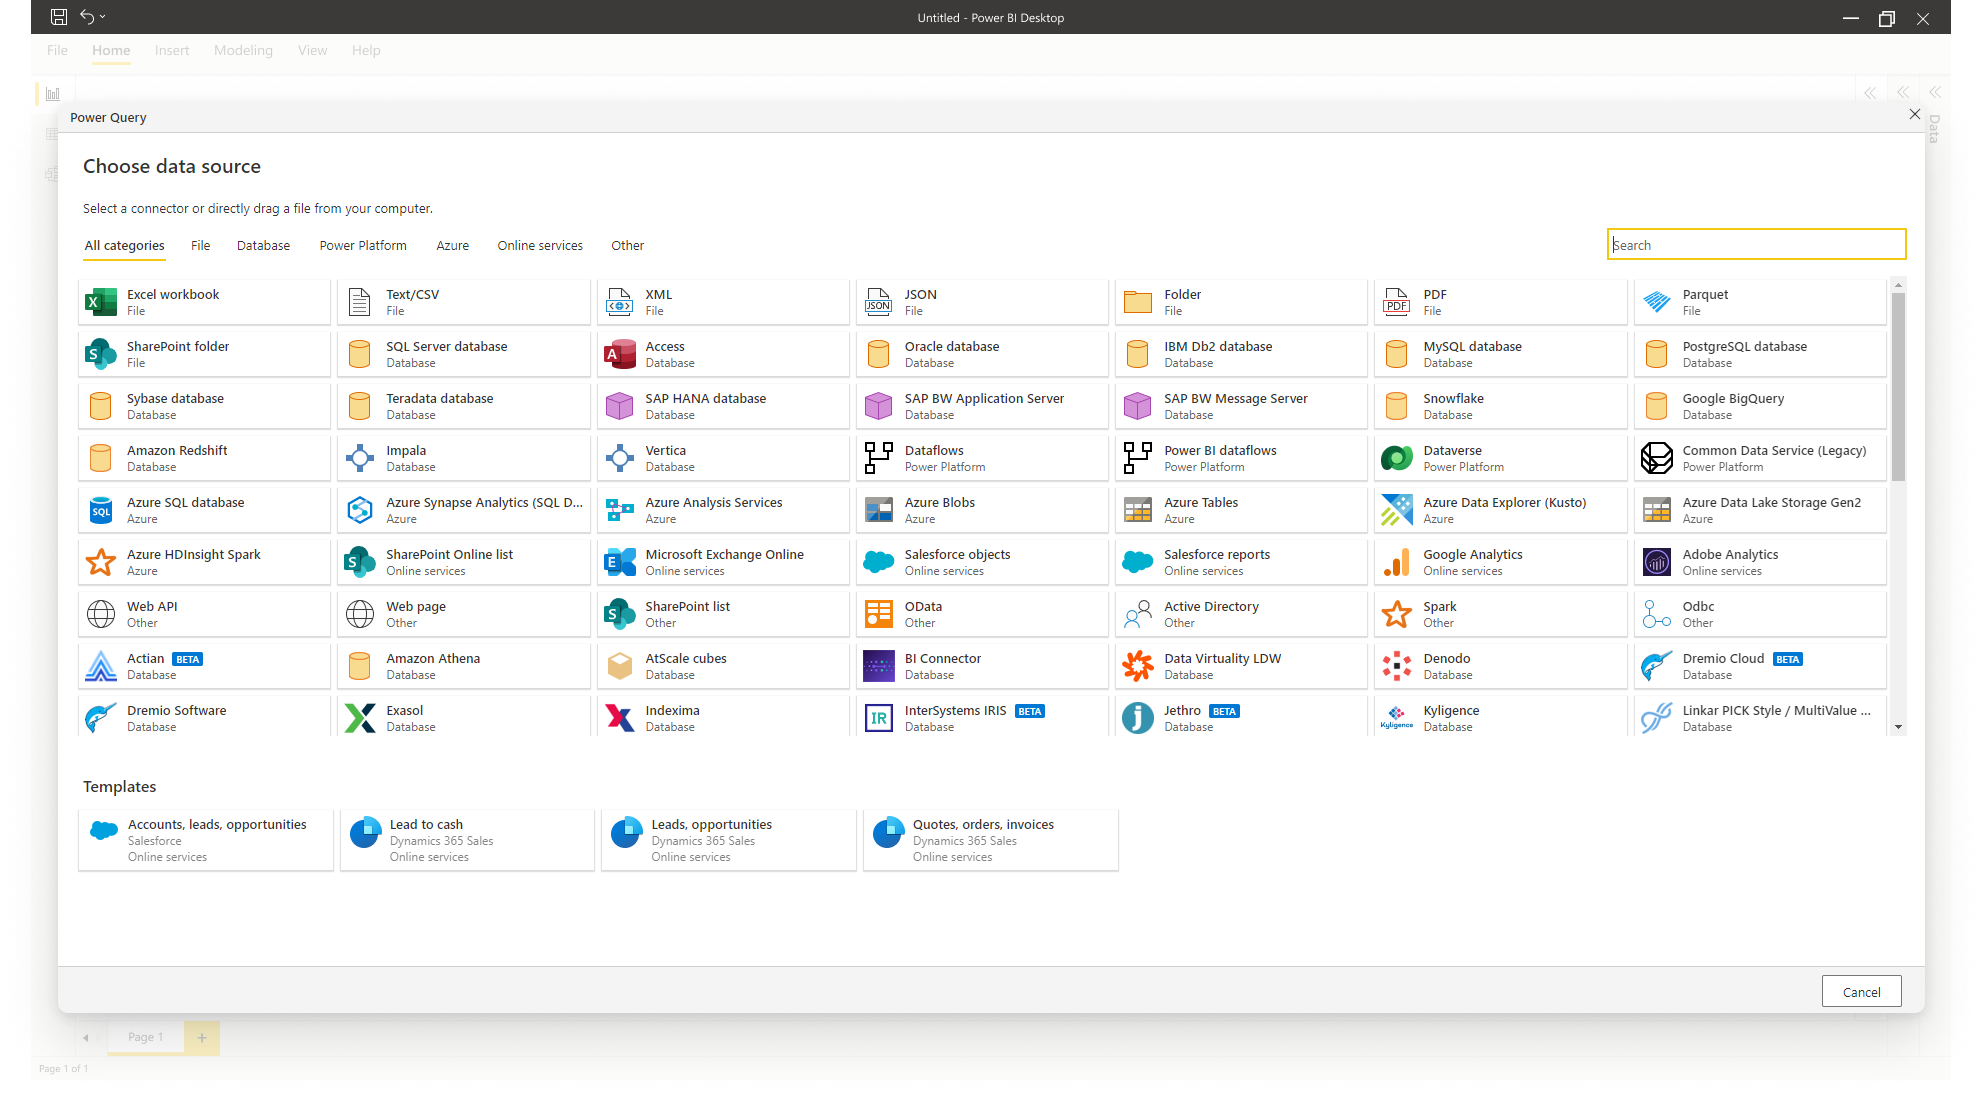
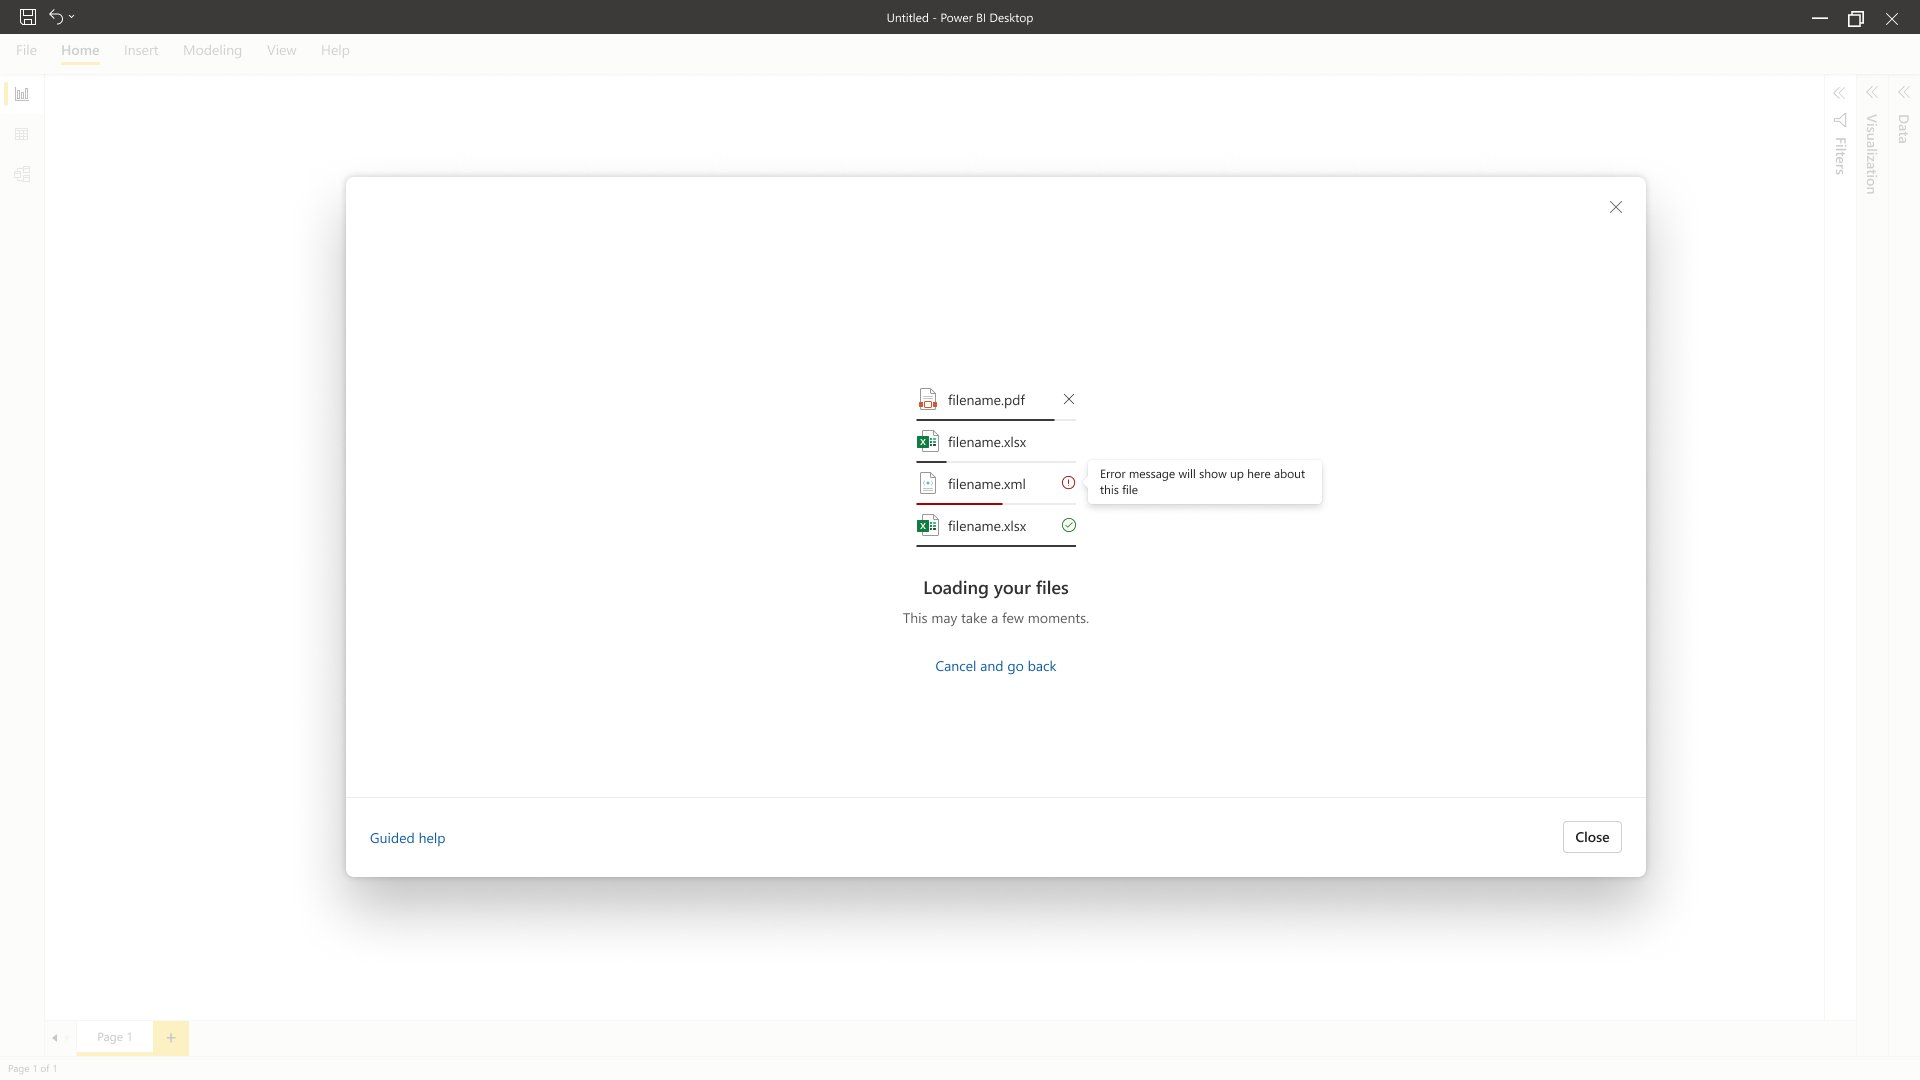
Selecting any type of data in previous screen opens this modal with many options to choose from making things even more complicated and annoying. Even if our users know what they need to, they have to go through each step that opens in a new modal, losing the previous modal's context without giving them any hint about what's next step or what's needed from them.
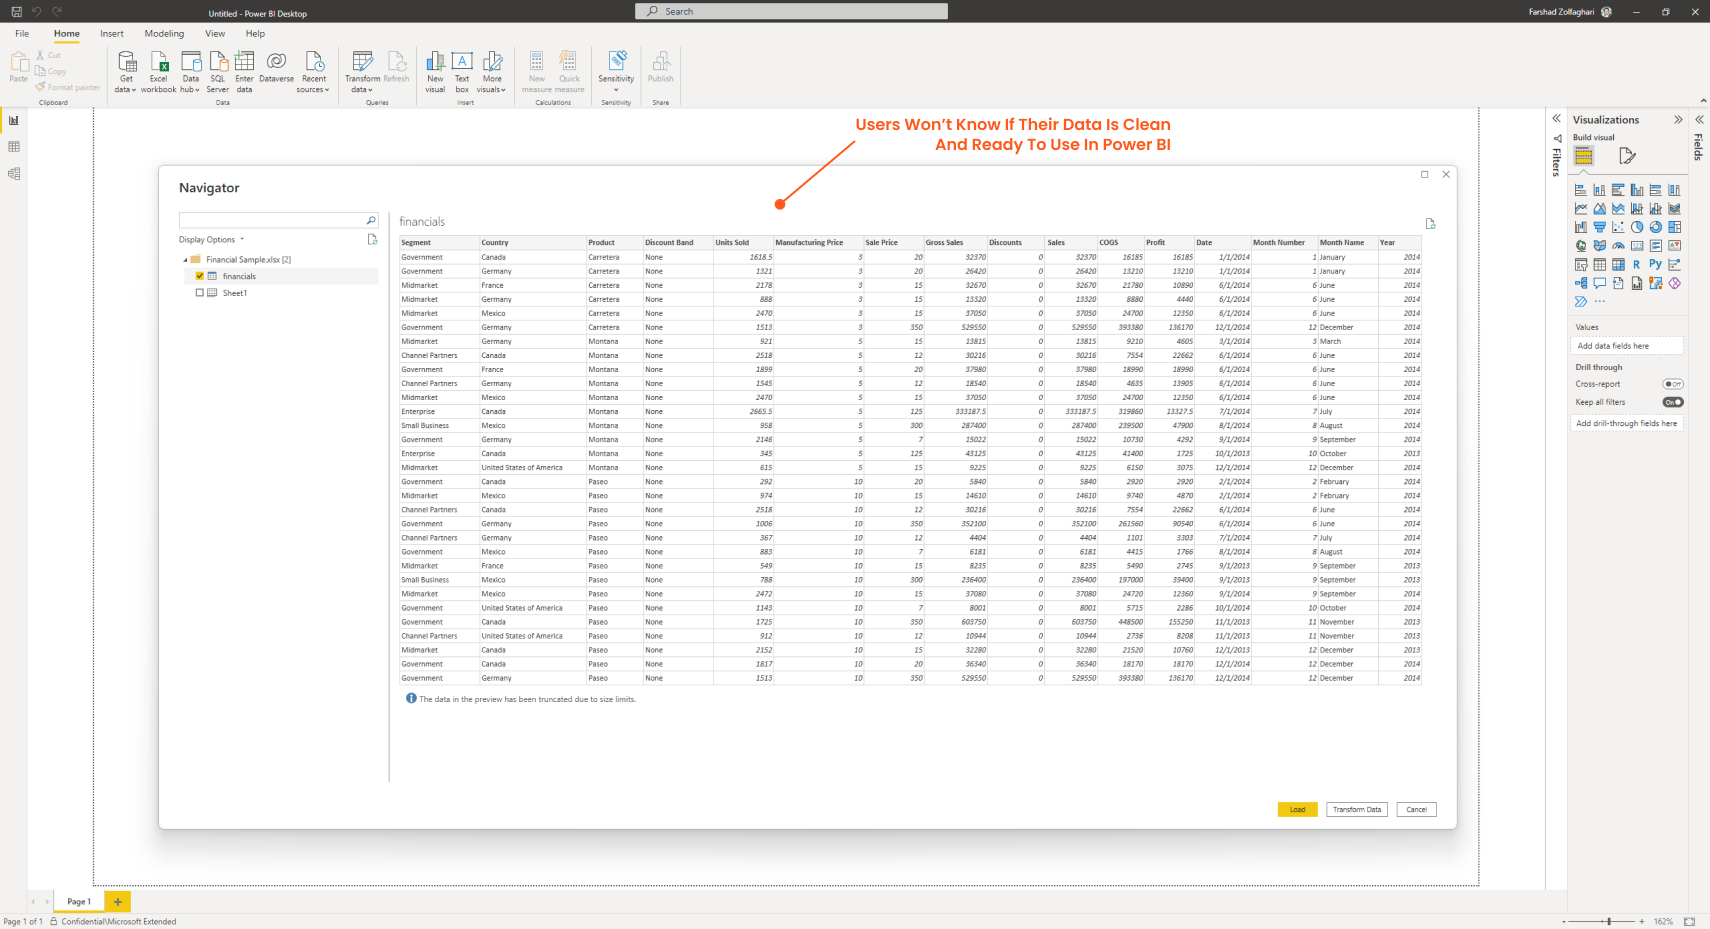
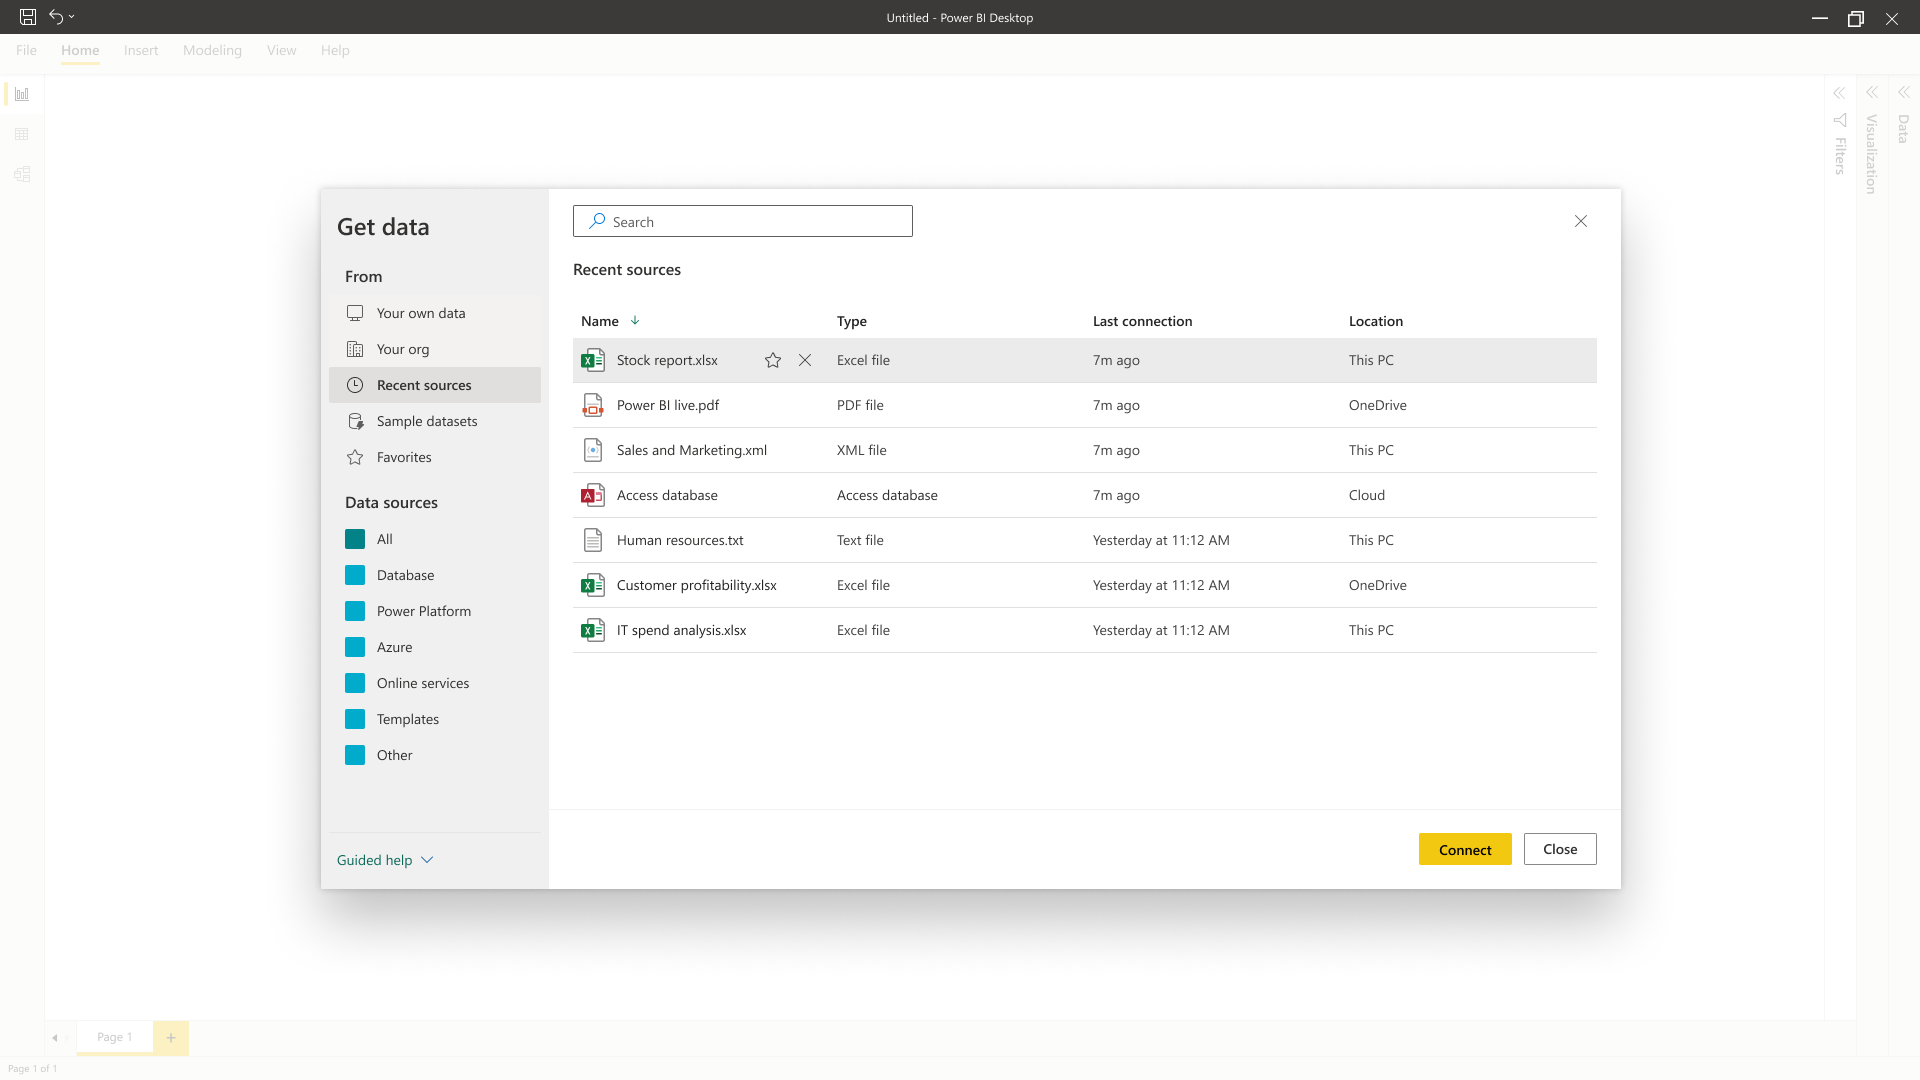
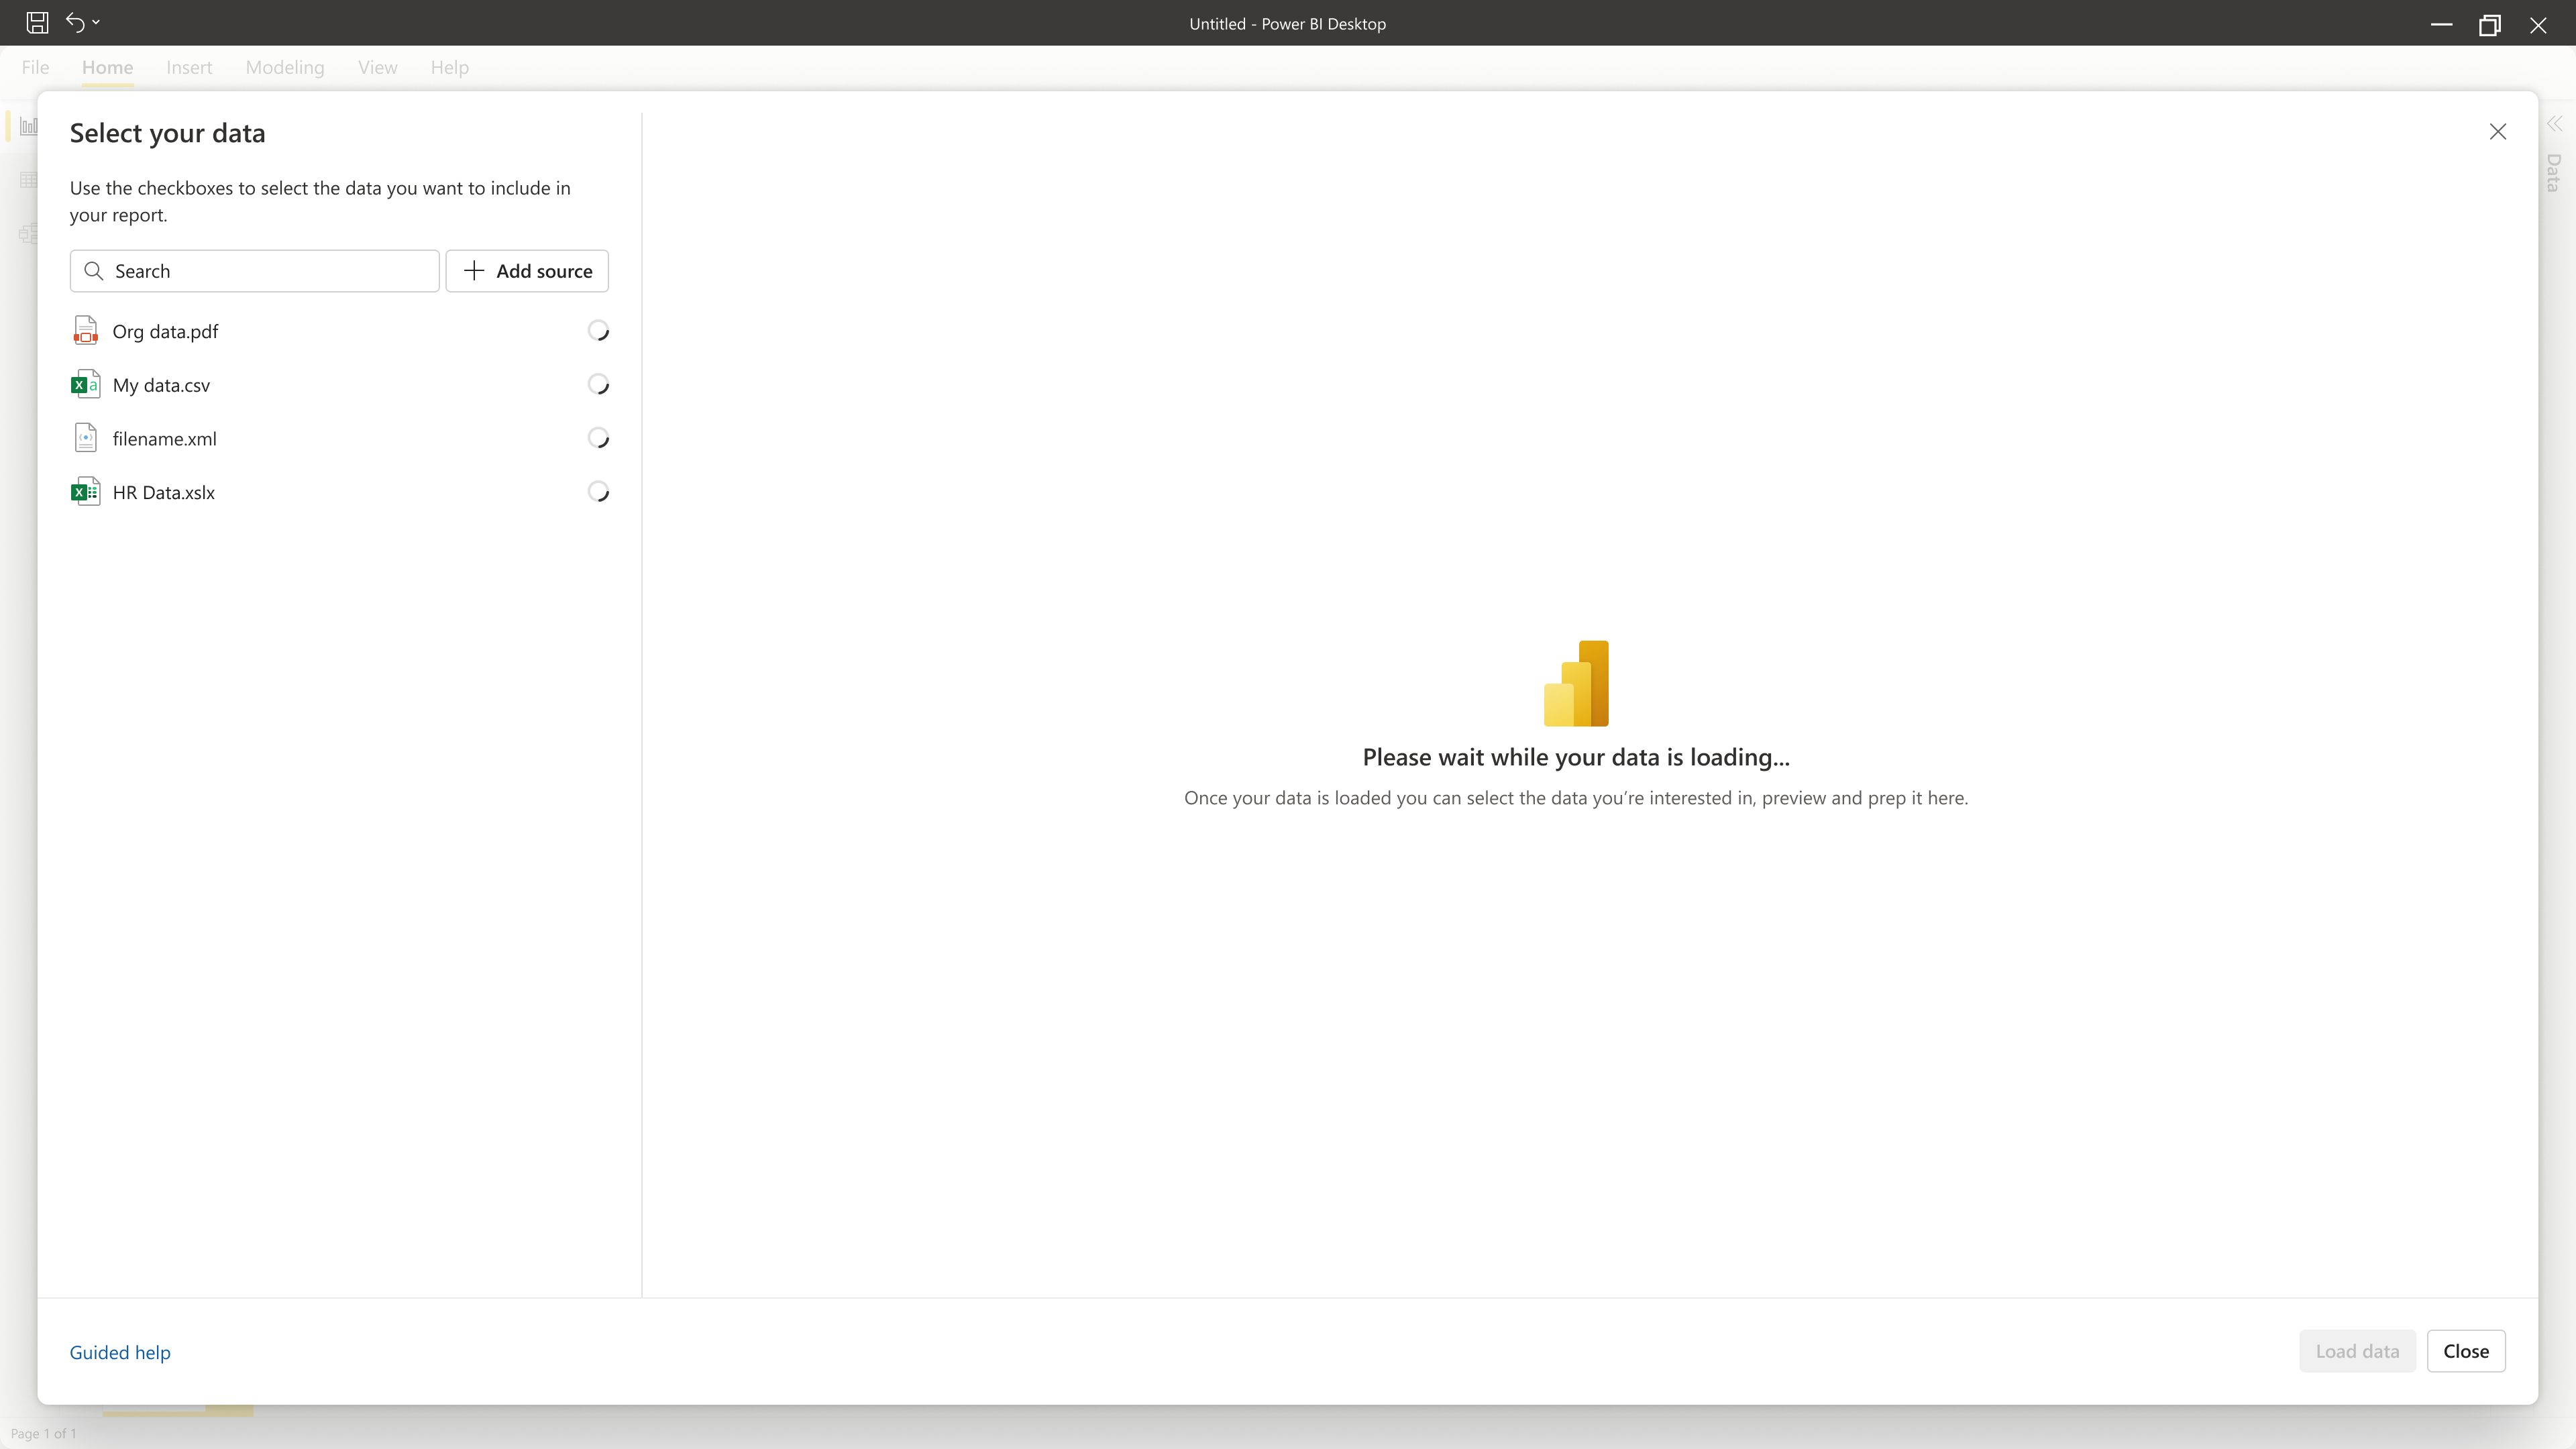
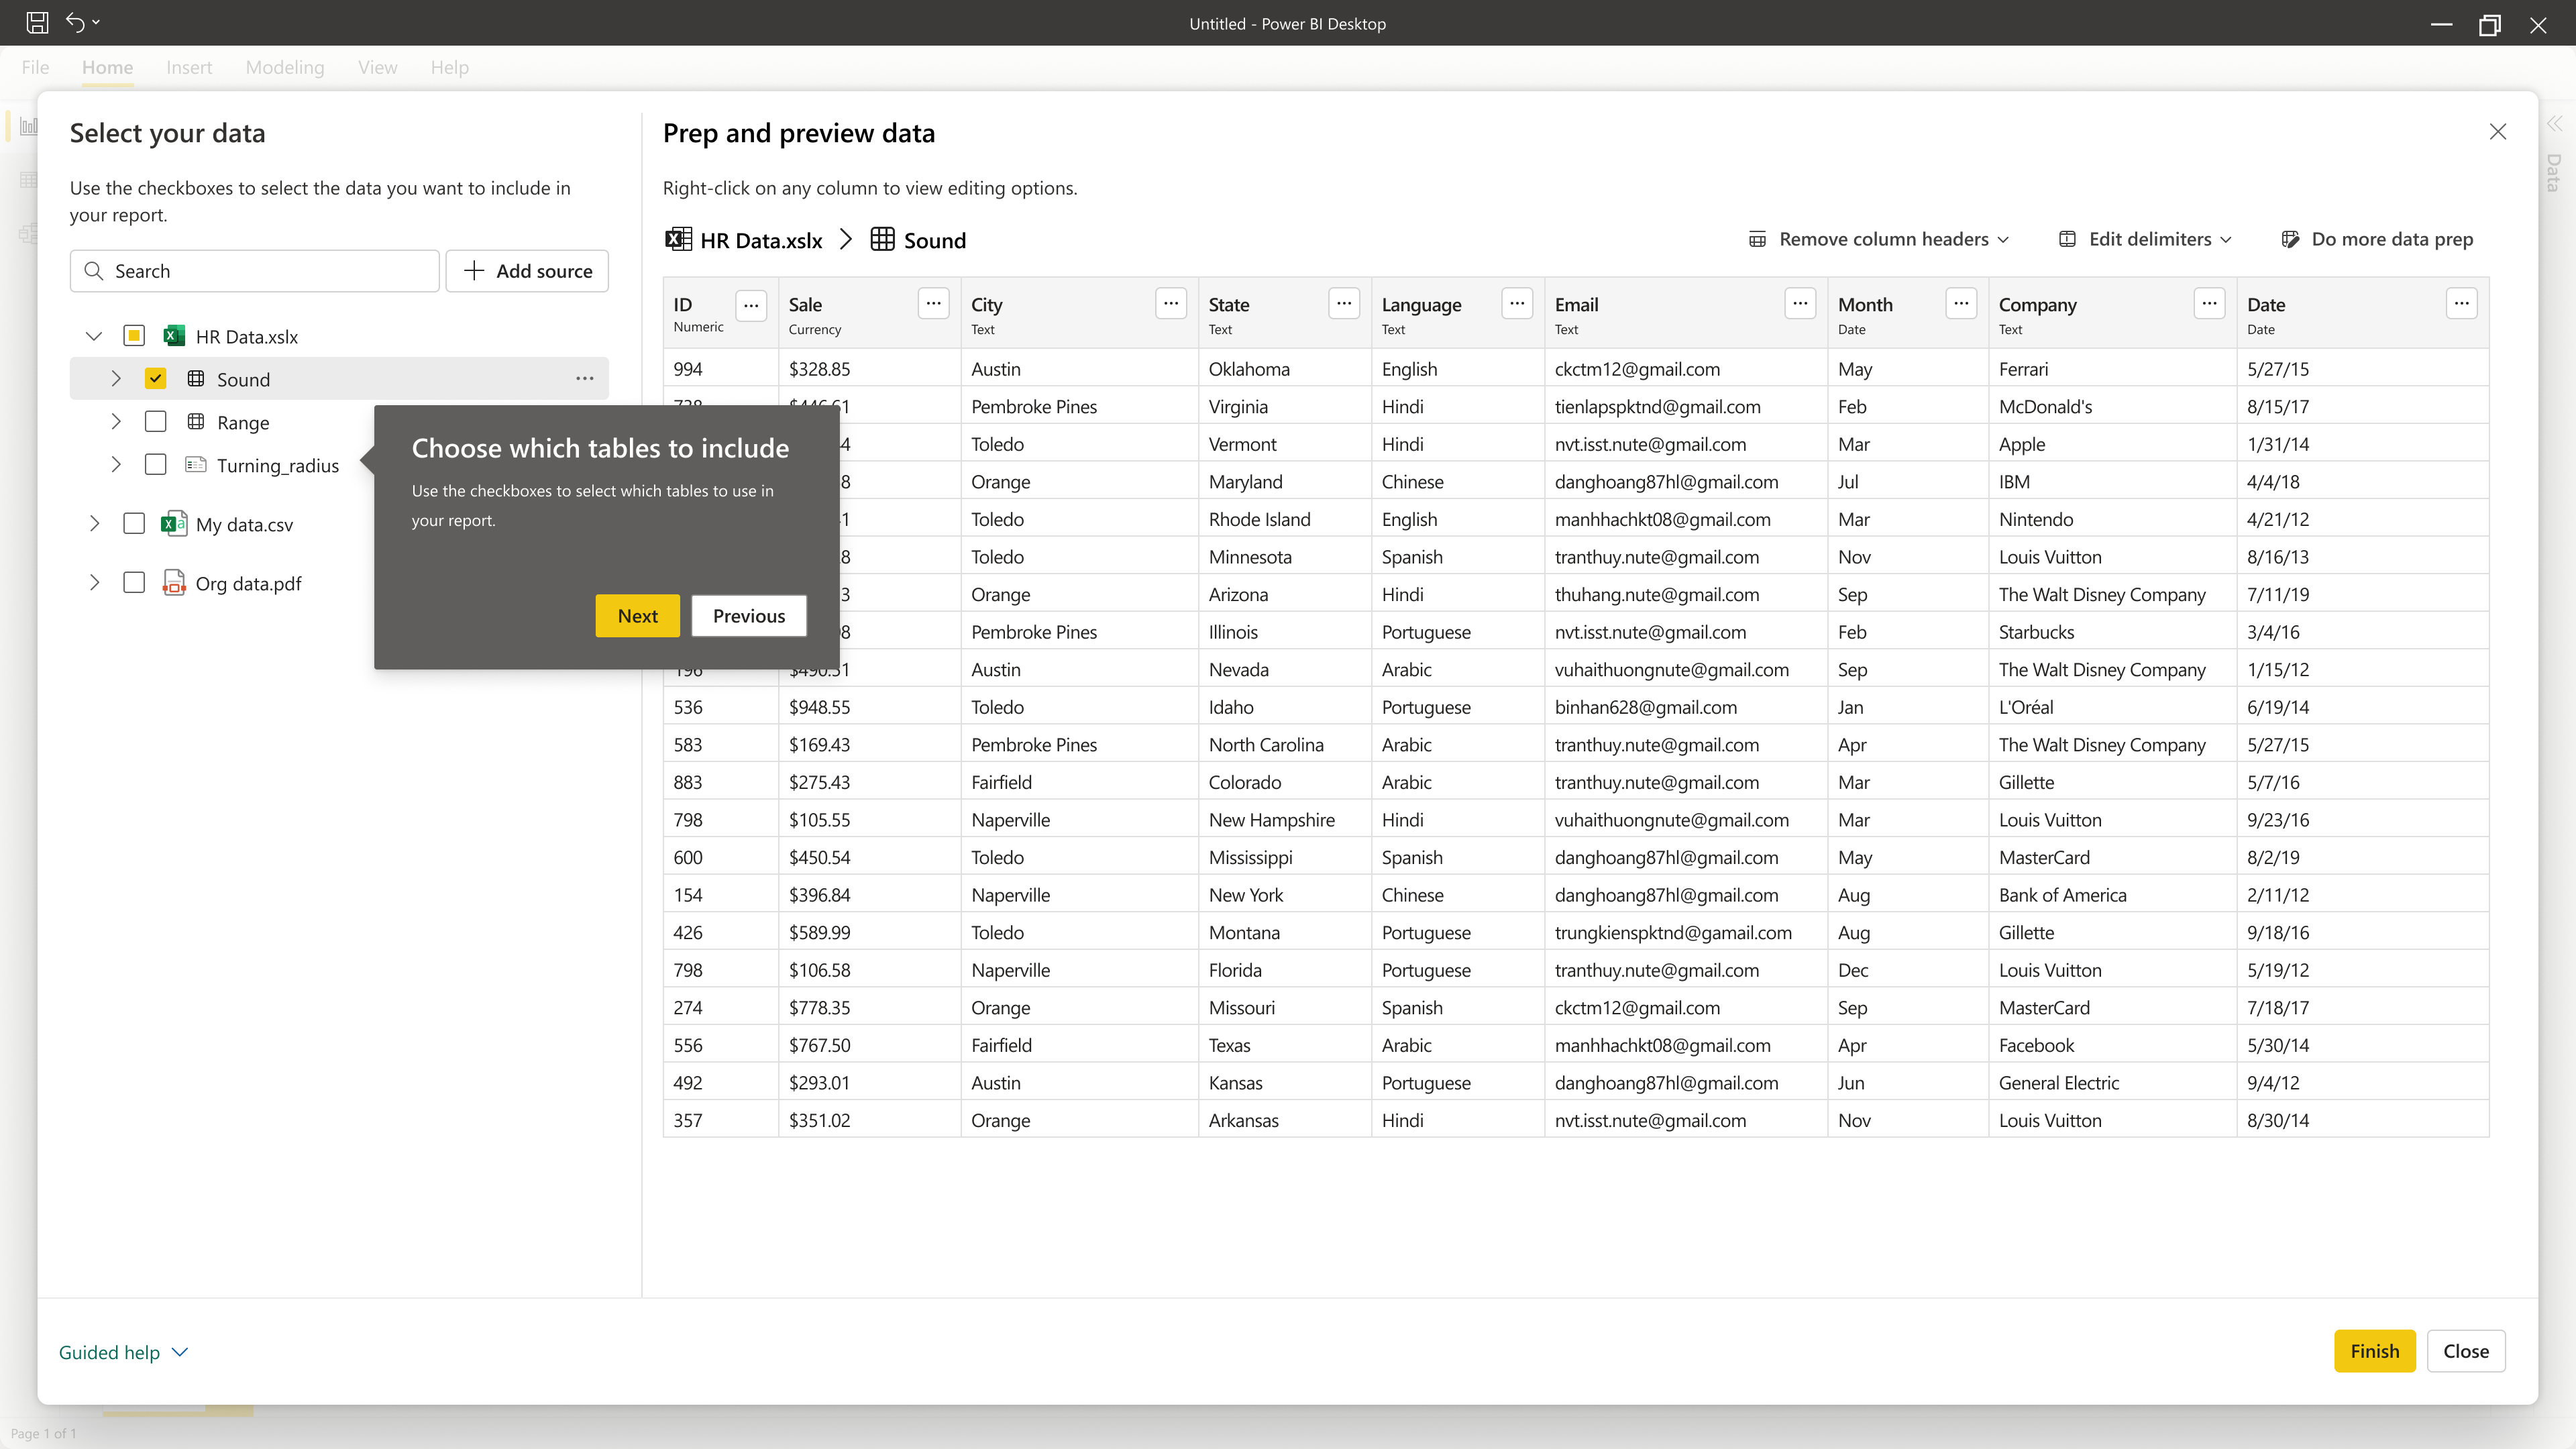
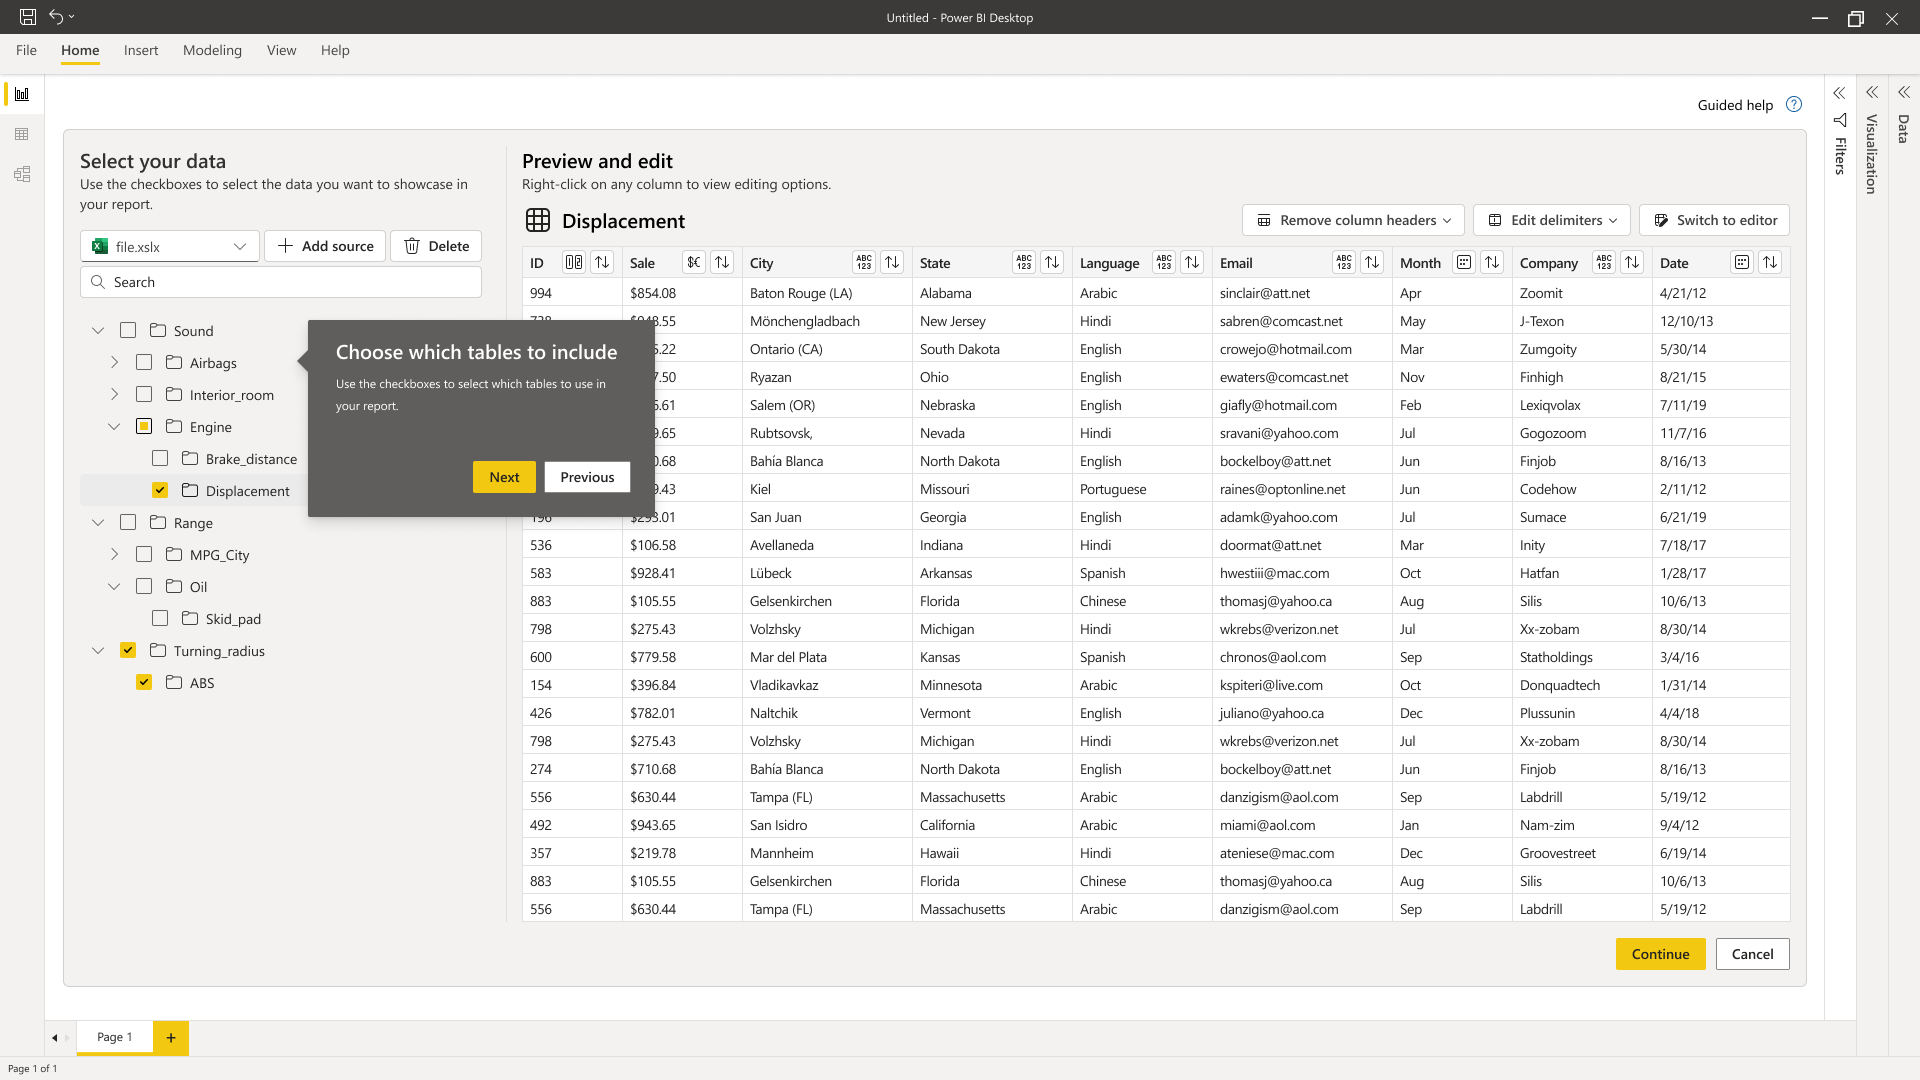
Once users found the data that is suitable to start working with, they will see another modal that asks them to choose which data or table they need to import. Also they need to be sure that their data is clean and properly formatted to be used in Power BI.
Problem is our app doesn't tell any of those to our users, they might end up importing some data that is not clean and end up seeing random errors.
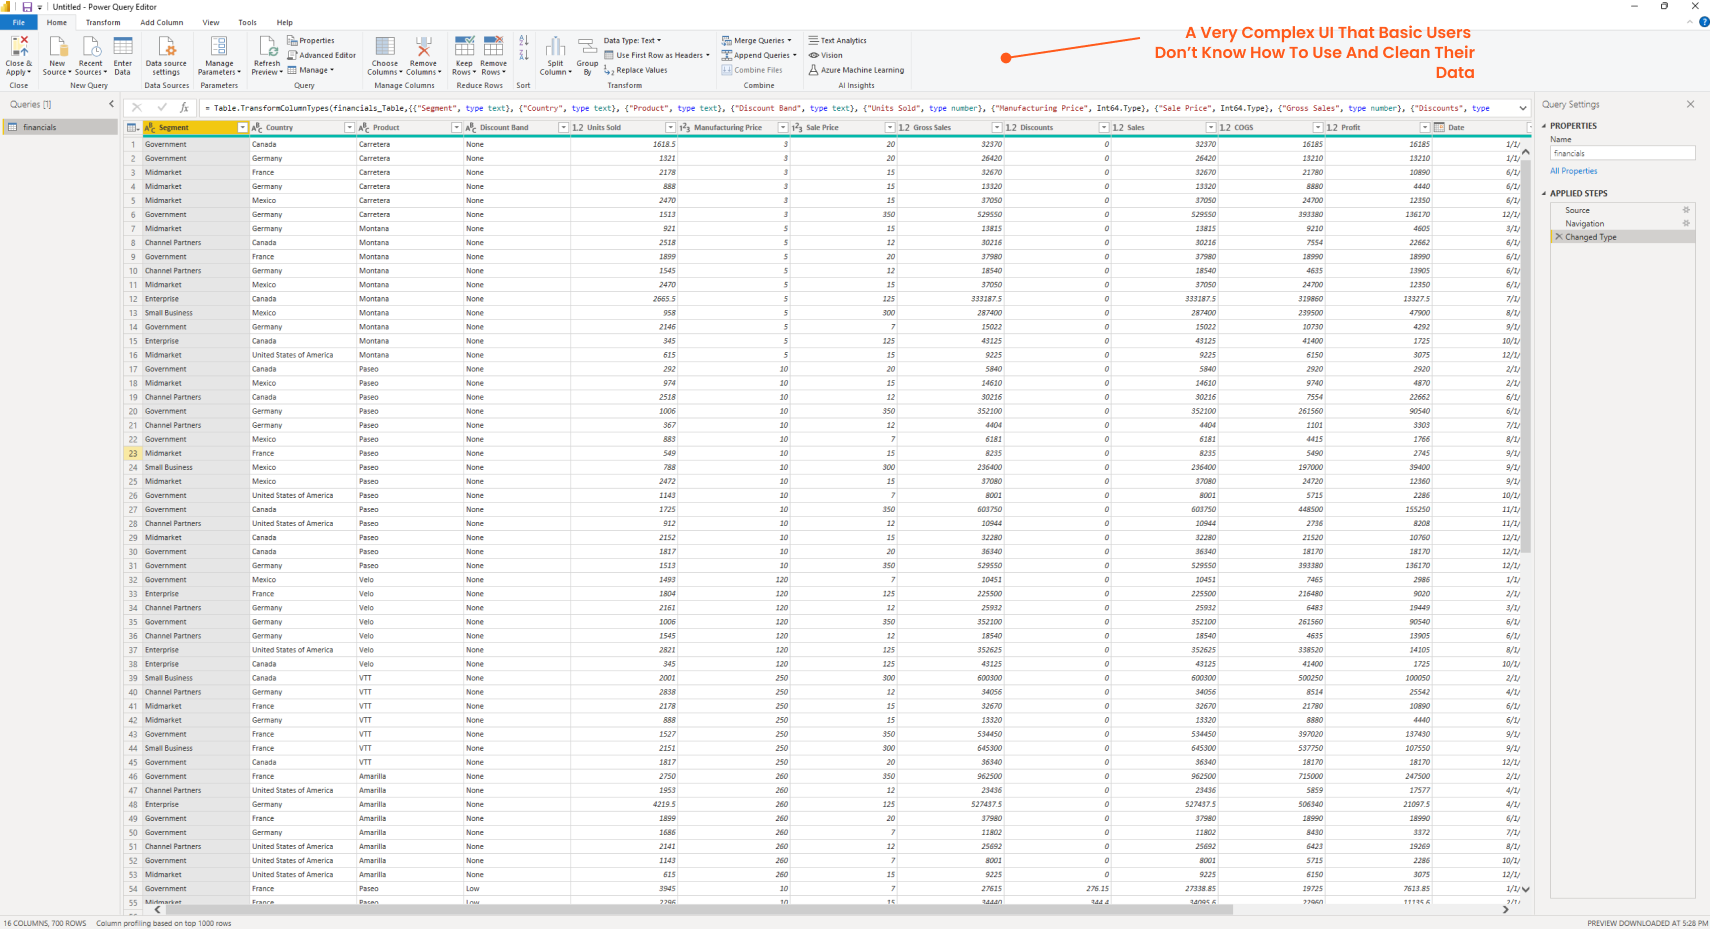
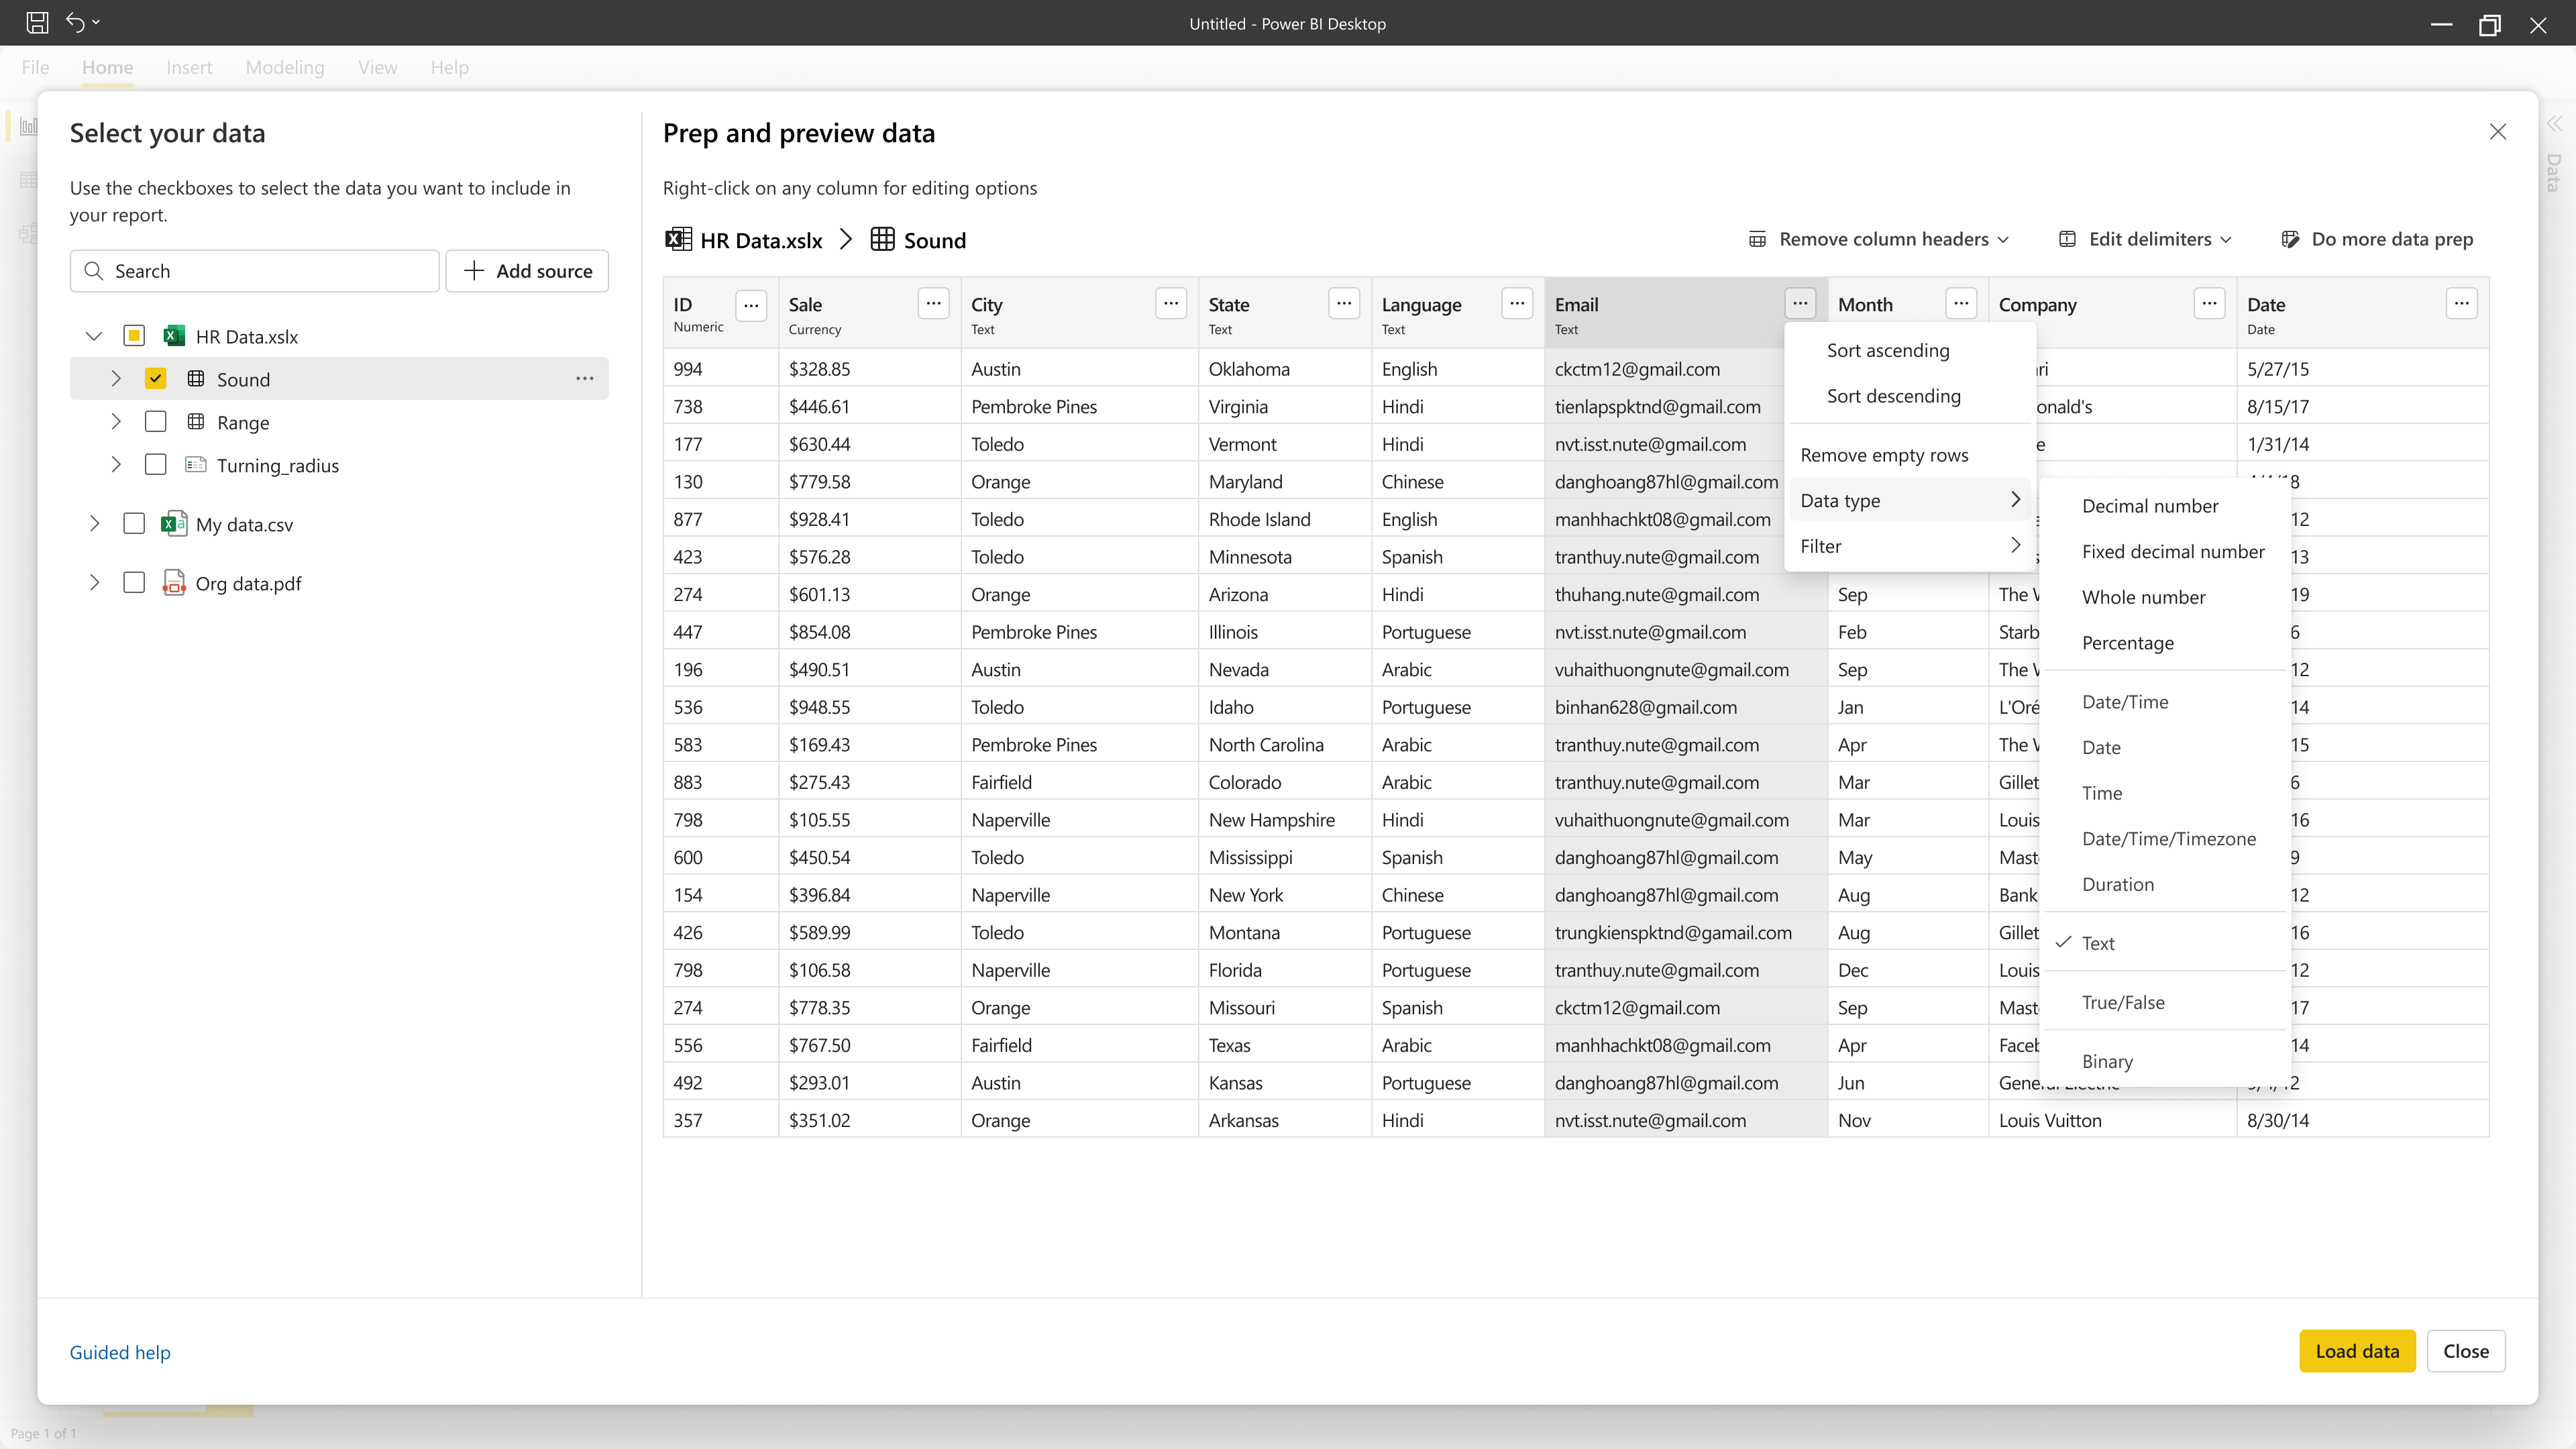
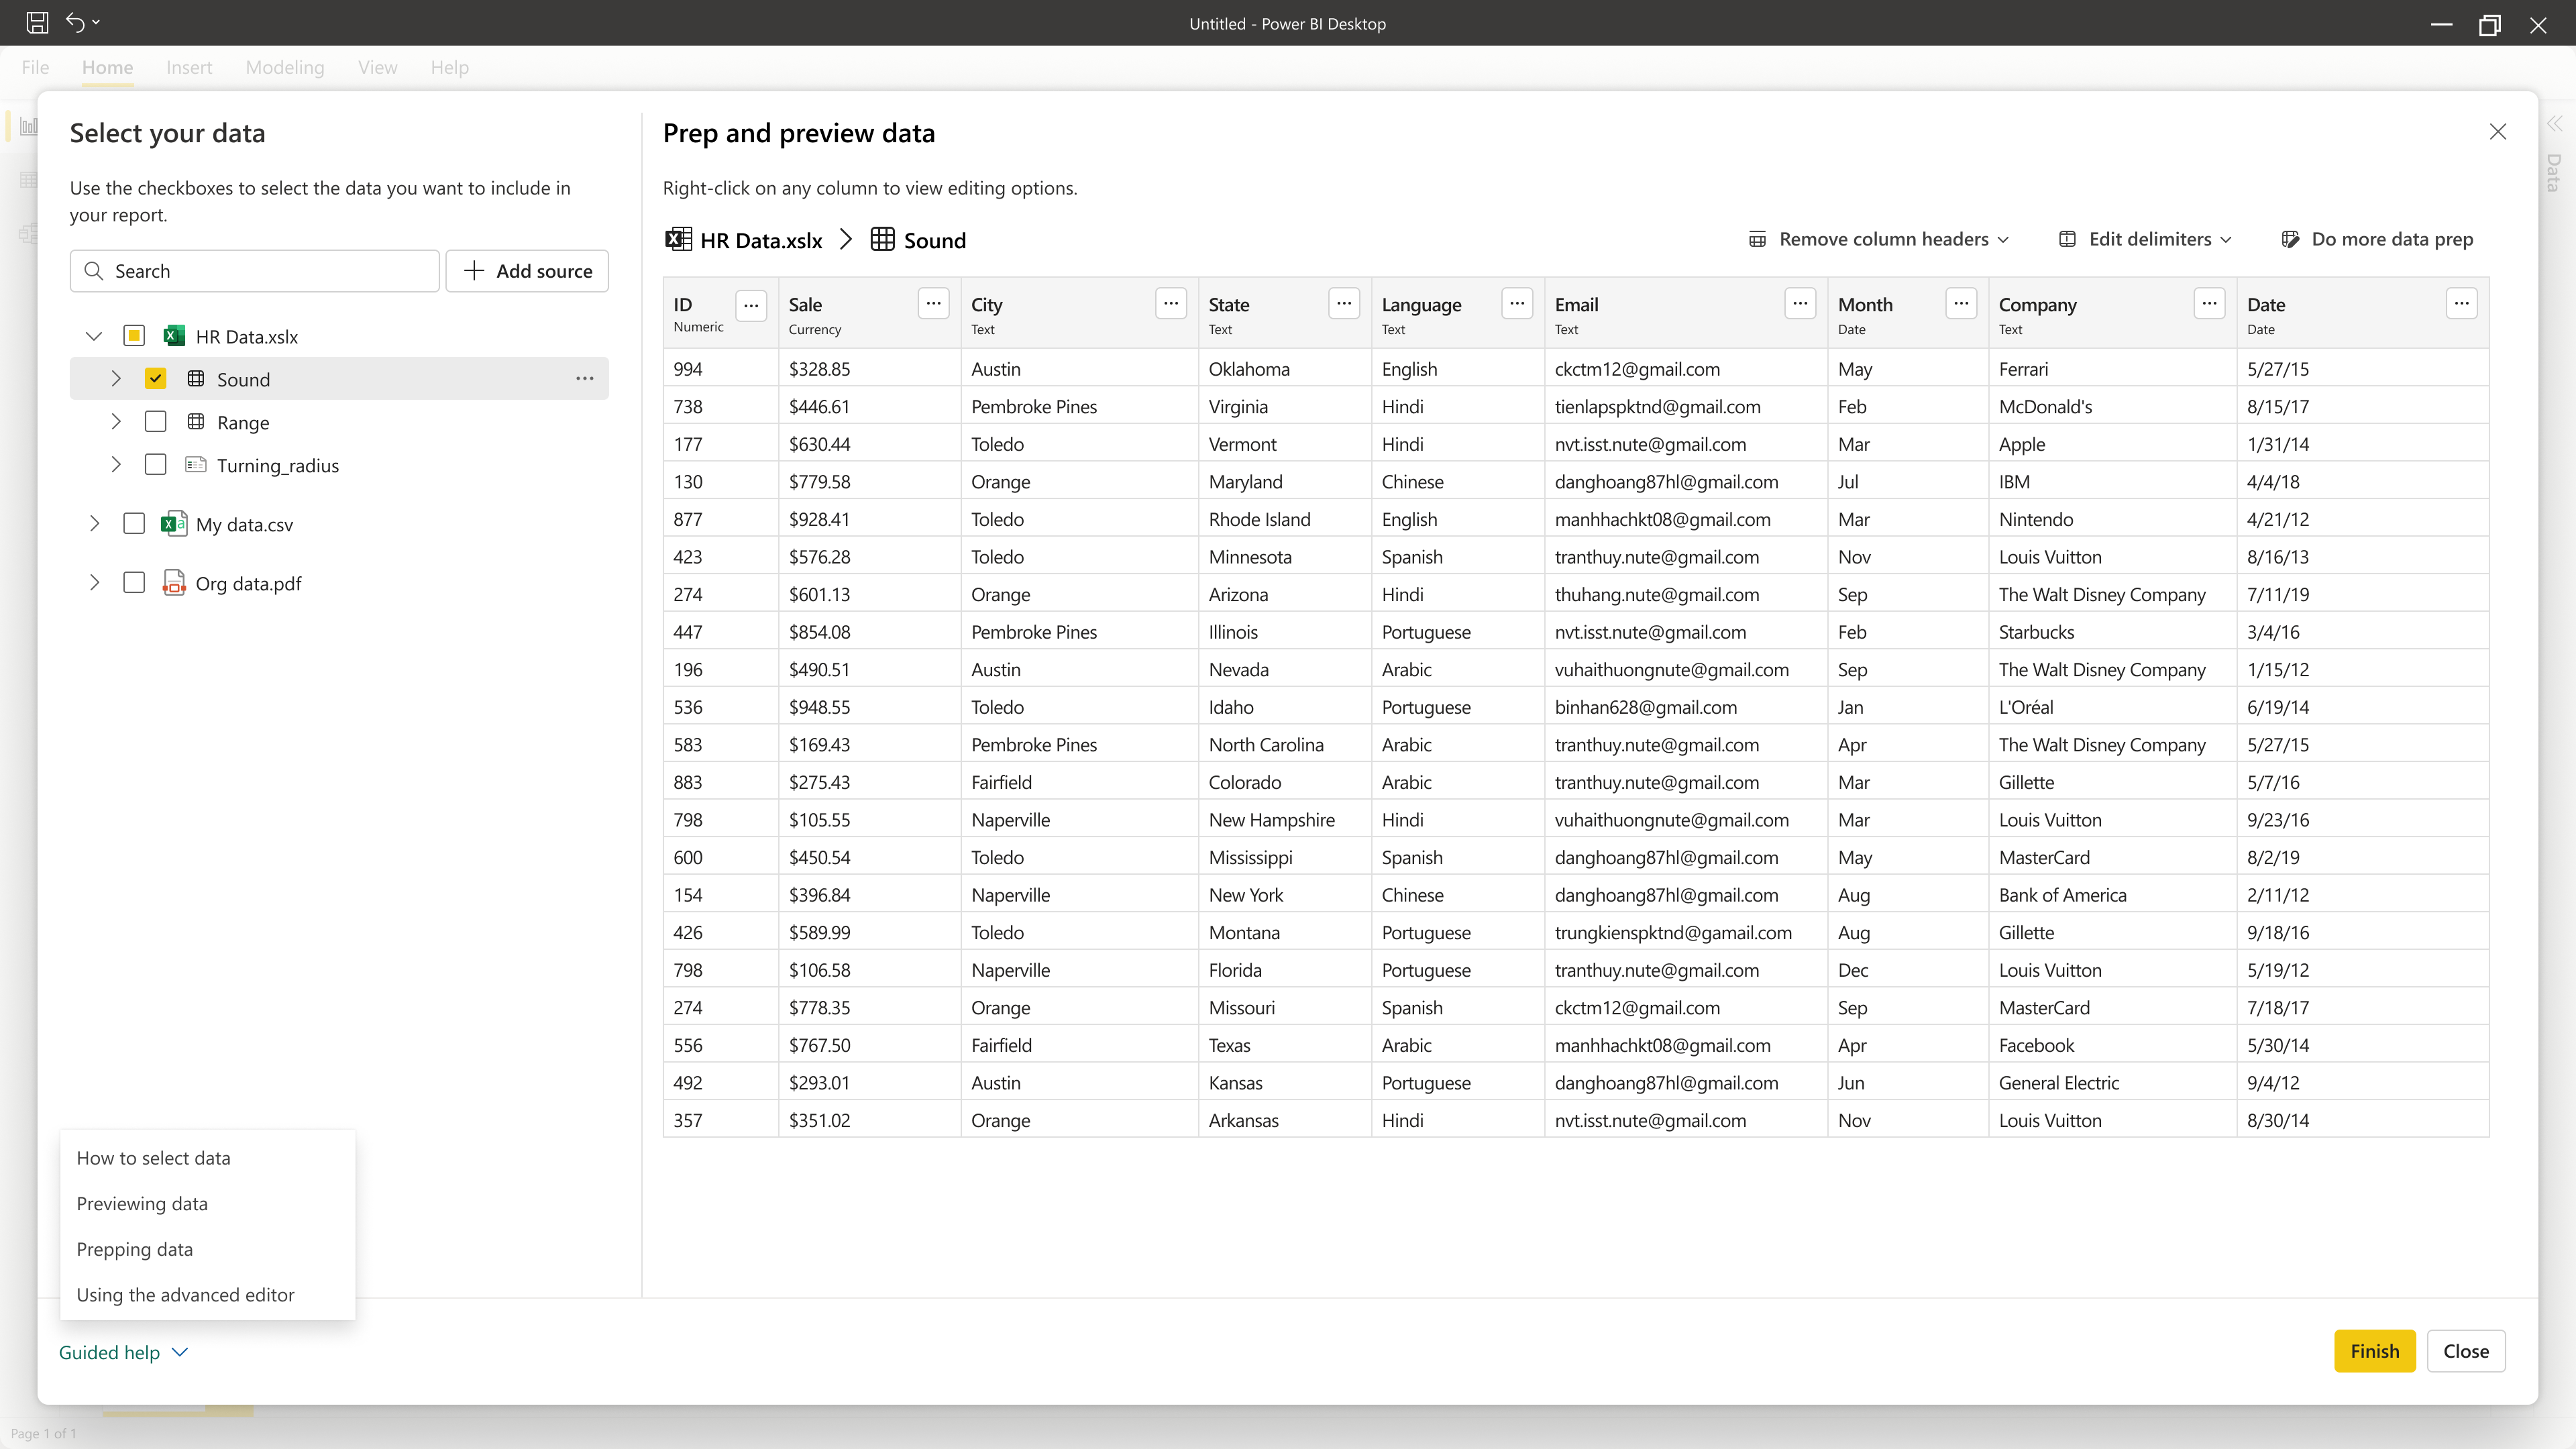
Even if users knew that their data is not clean and clicked on Transform data in previous screen, they end up in this UI which is super complicated, overkill and feels so disconnected compared to previous screens.

Lorem ipsum dolor sit amet consectetur adipisicing elit. consectetur numquam magnam, sed perspiciatis mollitia nesciunt amet, consequuntur error culpa nobis dolore asperiores eum non quasi duis cursus, mi quis viverra ornare, eros dolor interdum nulla, commodo diam libero.
The initial steps of creating a Power BI report involve selecting and preparing the right data, which are fundamental to the report's success. However, if users struggle with these steps or bring the wrong data, it can lead to frustration and confusion, potentially leading them to abandon the platform.
To address this, we aimed to simplify these fundamental processes and provide clear guidance to users, boosting their confidence in creating successful reports.
Early on in the project, I leveraged my past experiences and learnings to create a comprehensive timeline that was divided into sprints, each with specific deliverables and collaborative tasks for the design process plus the status of each item.
This approach proved highly effective in keeping our team on track, informed, and focused on achieving our objectives.

One of the other major design decisions that I implemented during this project was documenting the process in Figma file. Each design has a side panel with sections for questions that have been asked during review process, comments that team members added, ideas that might solve some review feedback or from team and changes that happened since previous design version. This way for example even if I leave the project, new designer will understand what happened so far and any reason behind all these decisions.
We defined these three principles through our design process to address the current issues and help users get to their goals faster and easier.
The business end user have simpler needs and correspondingly needs a simpler experience. They will most often have a single source, and even just a single table, and will at most only need the most simple of data cleaning steps. They just have some data and want to visualize it.
They will eventually graduate to full query and modeling capabilities but need a simple first run experience to start their Power BI journey.

Along the way we faced many challenges and needed to coordinate with many teams to address these issues as well as our passionate users that as many of you know changing something after couple of years is going to be hard for them. There were more than 150 data connectors that each had unique properties and settings and we needed to consider all possible scenarios in our new design.
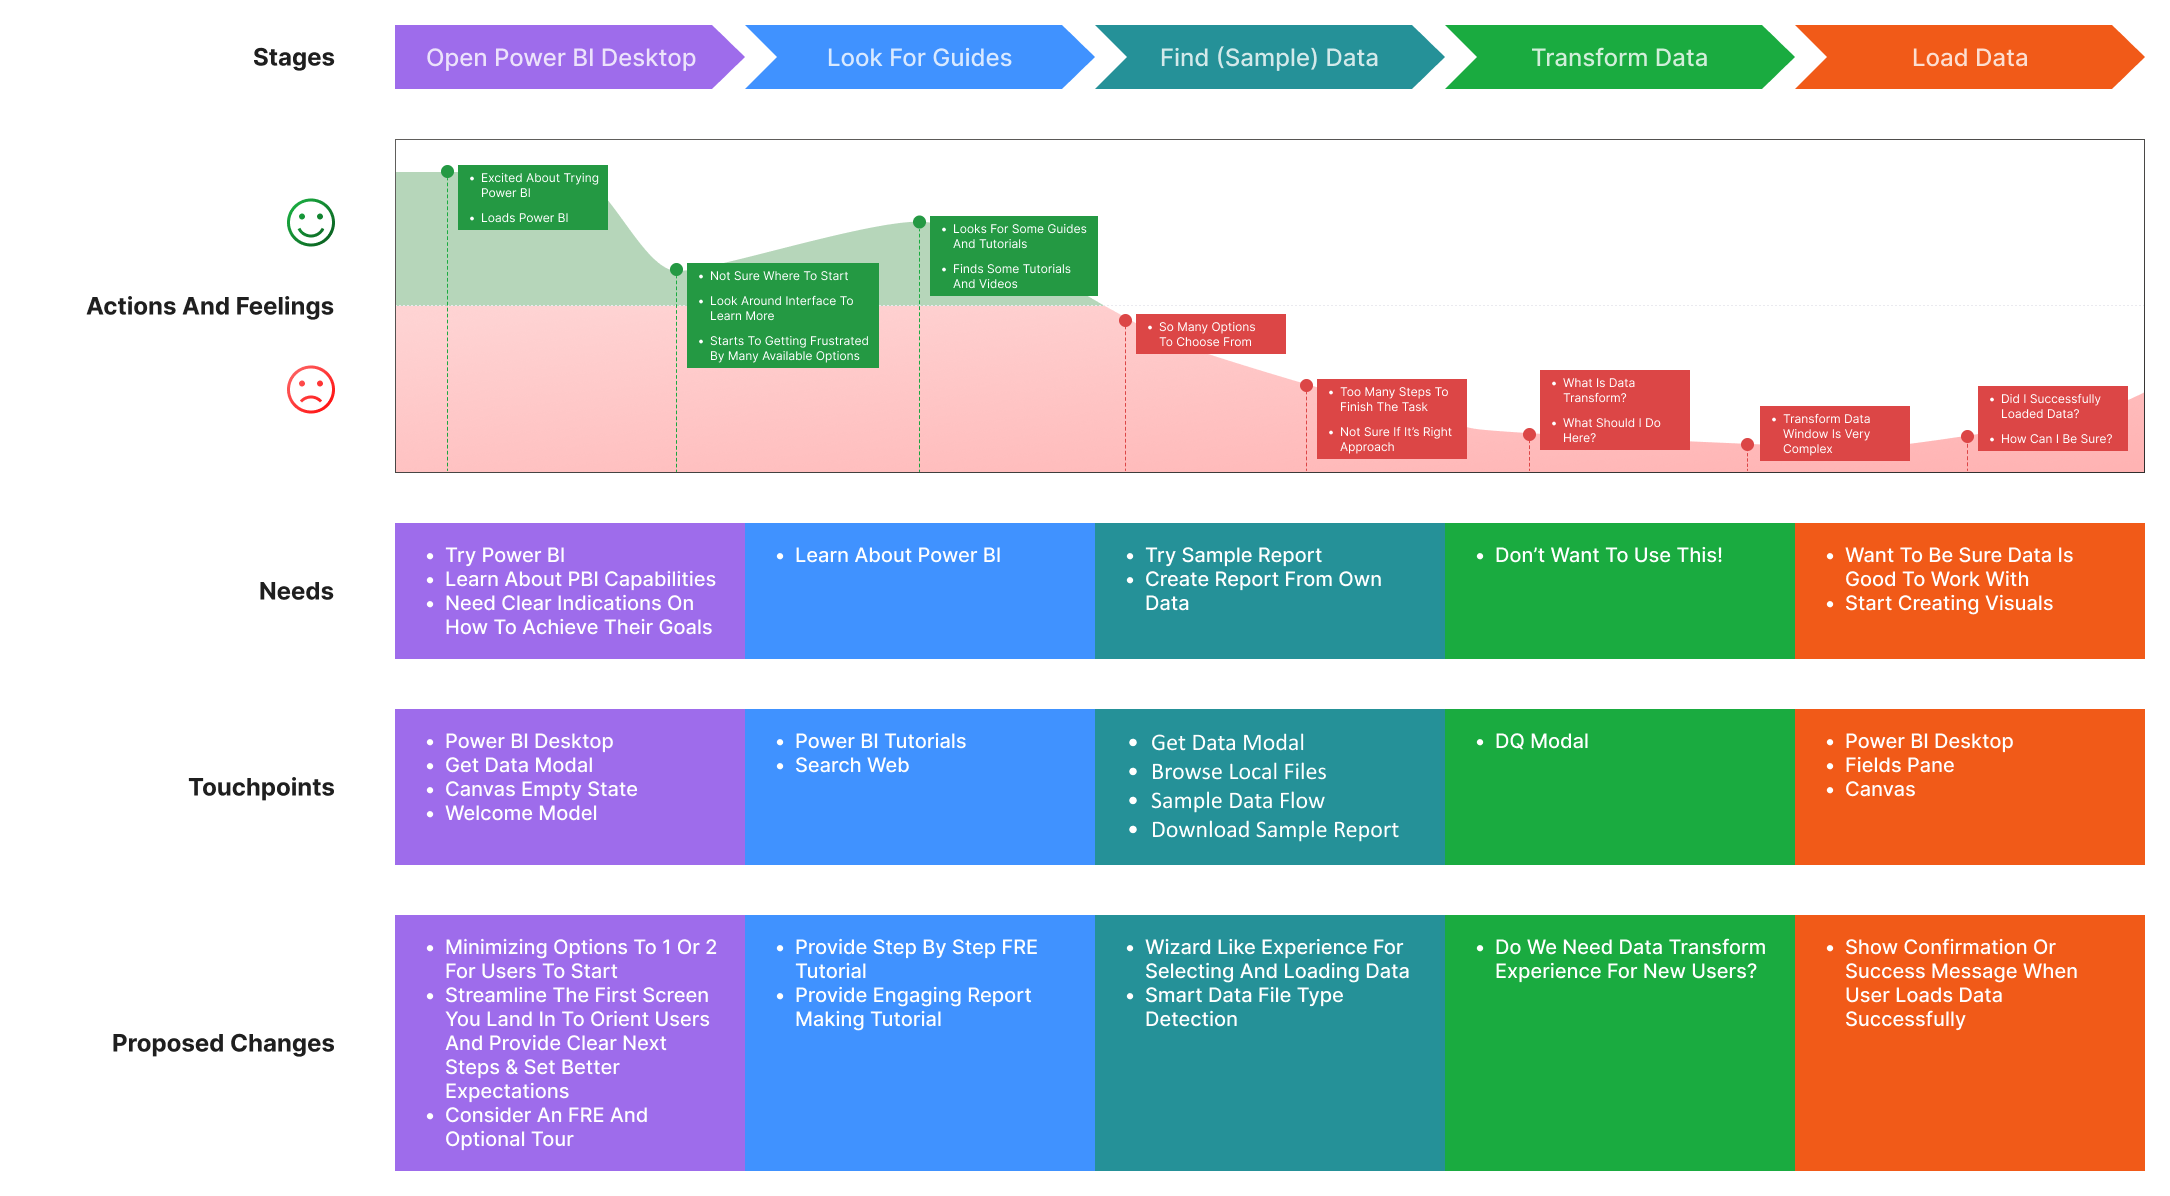
After numerous brainstorm and collaboration sessions with our team and many iterations, I created our current user journey map to highlight the pain points, needs and possible solutions for each step in the process of bringing data and preparing it for report creation.
This helped our team to understand where we should put our main focus and what are the highest priority pain points that we need to tackle first.
After reviewing journey maps, previous benchmark studies and user surveys, we know lots of new Power BI users have difficulty start creating their reports. Our goal is reduce that steep learning curve with this refreshed experience for getting data ready.
I gathered all stakeholders, researchers and other team members and asked them to start add anything that you think would solve our issues. From previous user studies that we ran, users feedback on our forums, any direct customer interaction and so on.
Gathered all information in FigJam and then started doing affinity mapping with all those ideas.
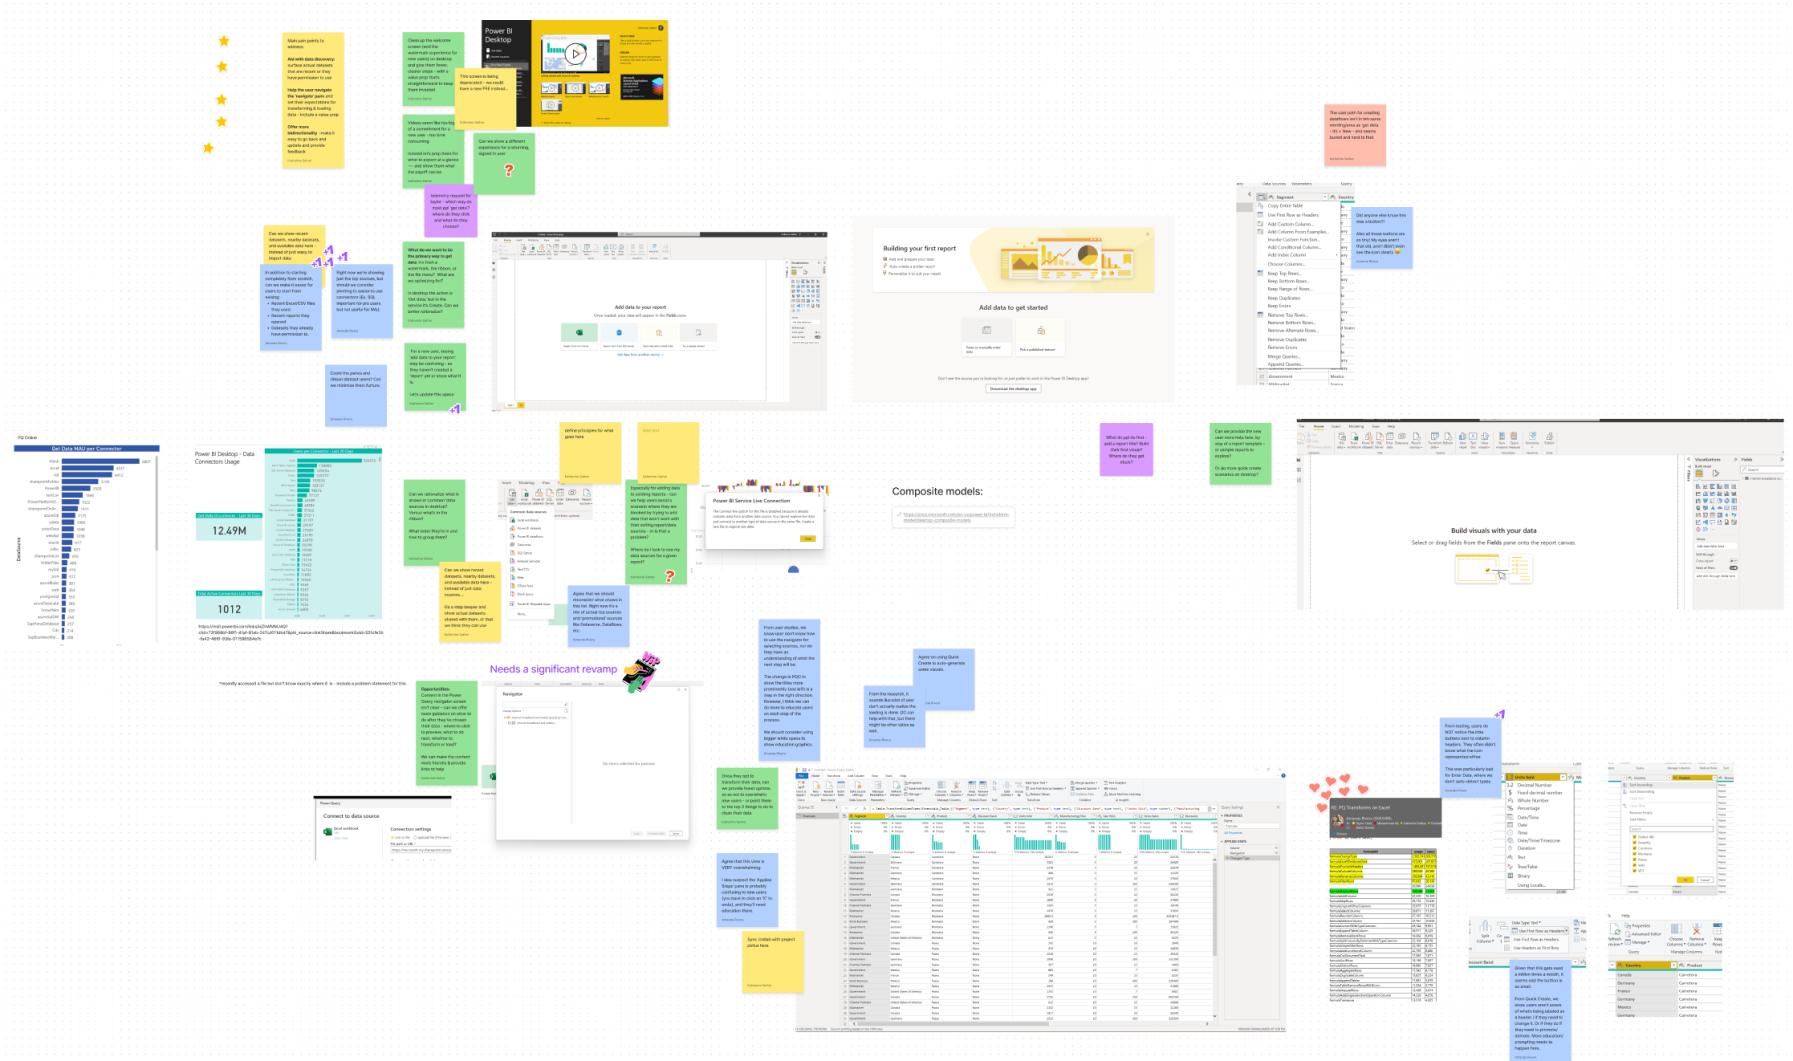
We found these major pain points and issues after rounds of brainstorming together:
I started designing some lo-fi concepts to explore possible solutions based on what we learned so far and tried to achieve these goals in my designs:
I Wanted to simplify all current multiple entry points and modals into one central location for users to bring and prepare their data. No more guessing where to go and start.
Decided to go with drag/drop concept since it’s very familiar and feels natural with Windows and web users.
My idea was to reduce cognitive load from users by letting them bring anything here and let us (Power BI) detect correct next steps based on their file and data type.
My idea here was to automatically detect issues of their data and clean it up for them or give them enough guidance to solve the issue.
There will be contextual help in every page that will help users if they get stuck at any step.
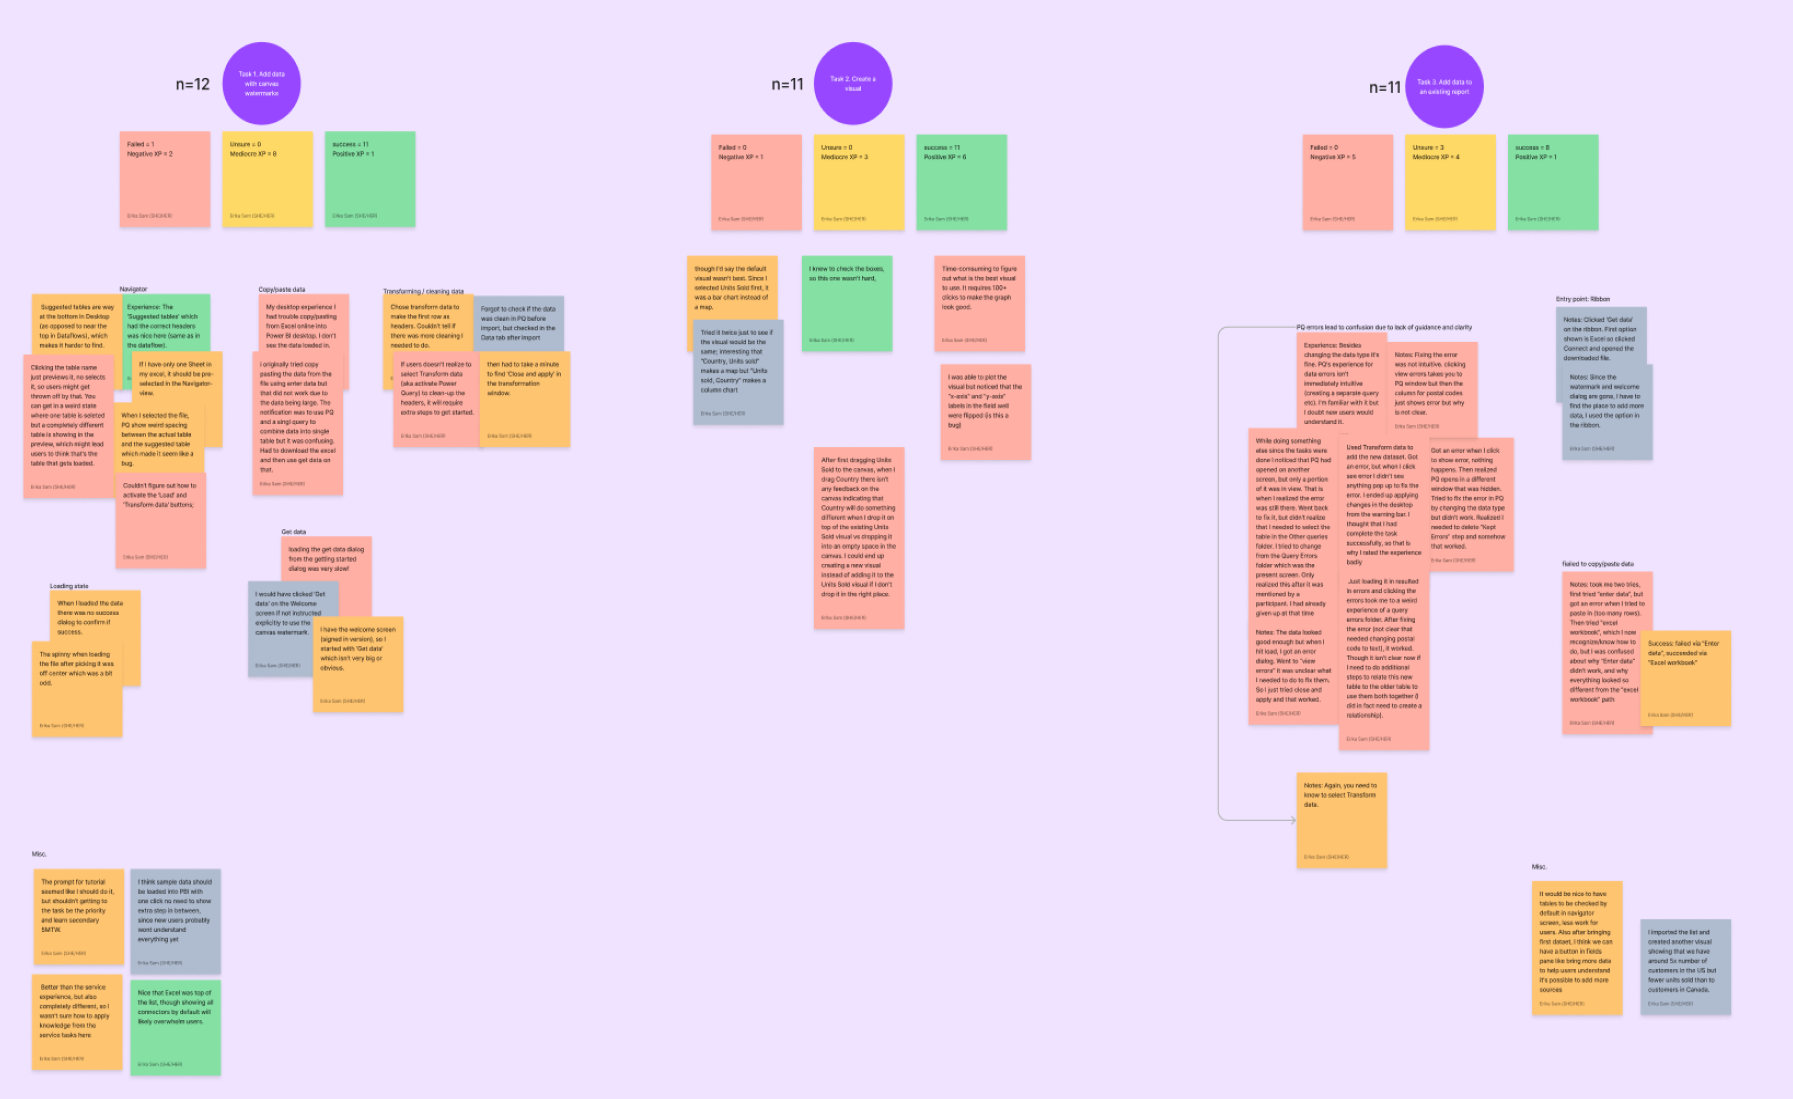
We tested these early concepts with 10 users to understand if we are on a right path or not before jumping into hi-fi designs. Here are some major takeaways from our study:
Users understood that they need to bring data to start when saw this UI.
Users noticed help button and mentioned couple of times.
Users immediately understood the drag and drop functionality and mentioned it makes things easier.
Some Got little confused about “Connect to data source” button.
They asked about what type of data can be dragged an dropped?
Some users mentioned they'll get annoyed after a while about the message on top
After doing initial research, I started going deeper into designs and details of each step for this scenario. You can read more about each part of the scenario and some the reasons for each design:
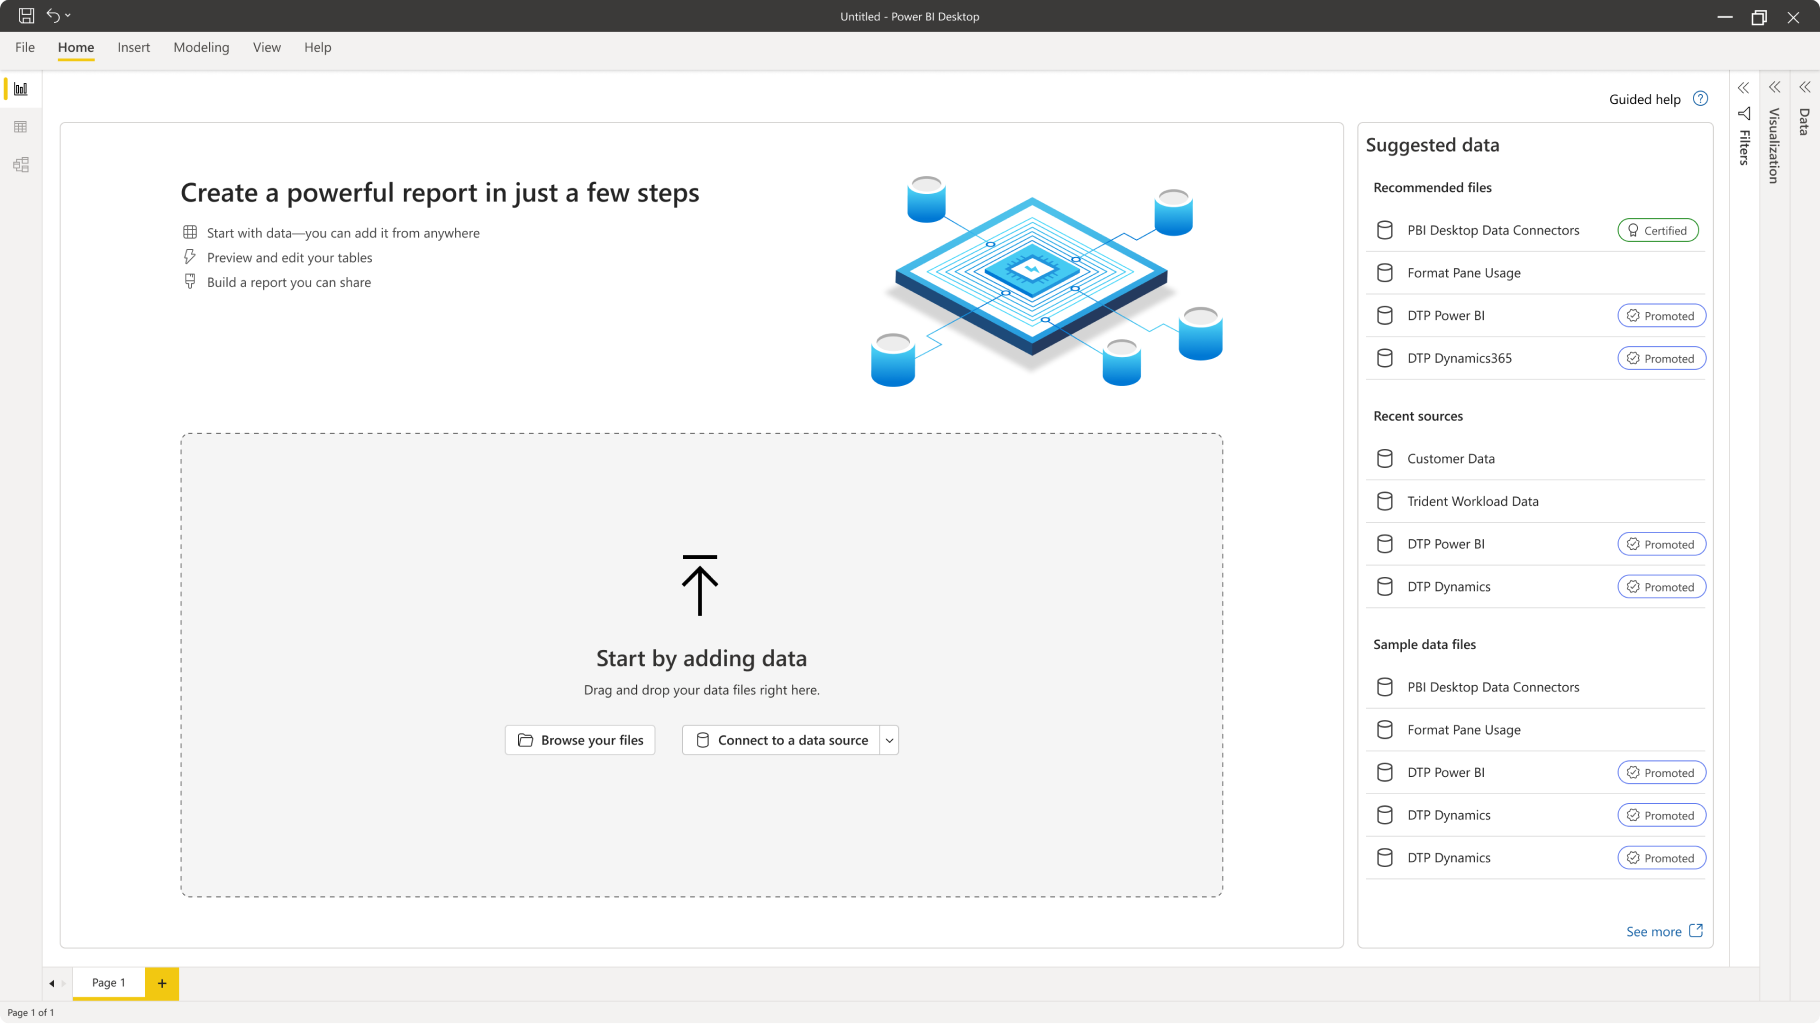
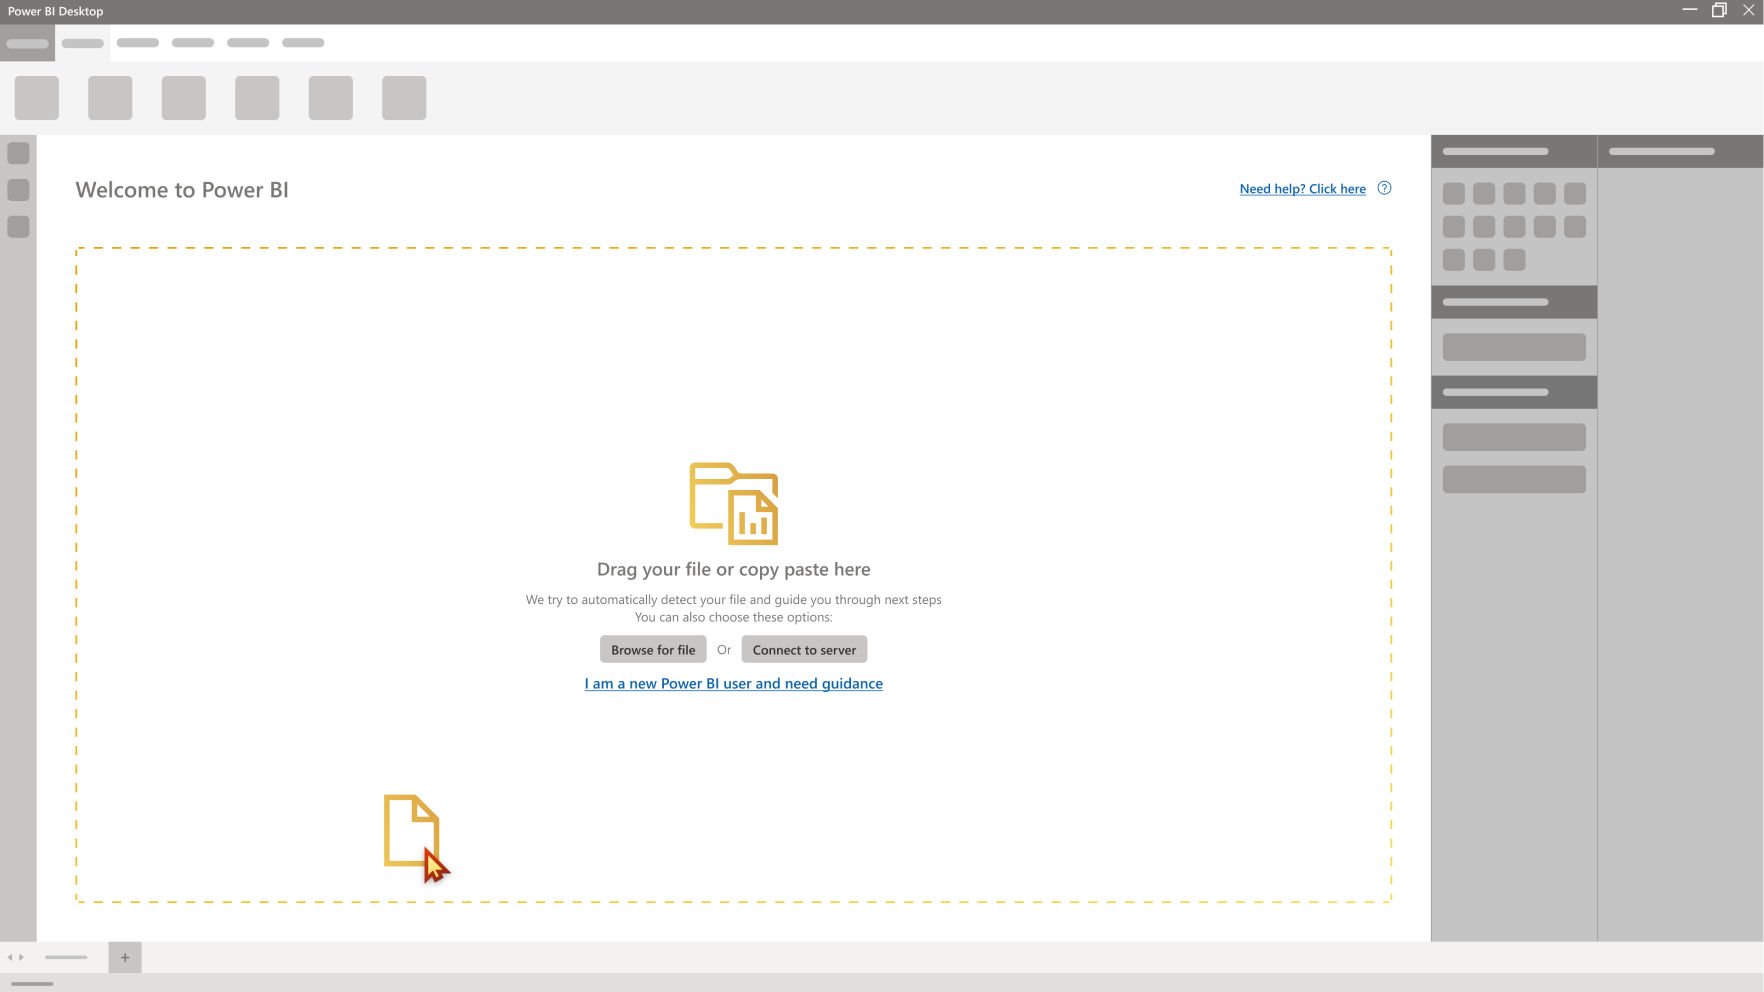
This is the first stage of scenario, users land on this page when they open Power BI.
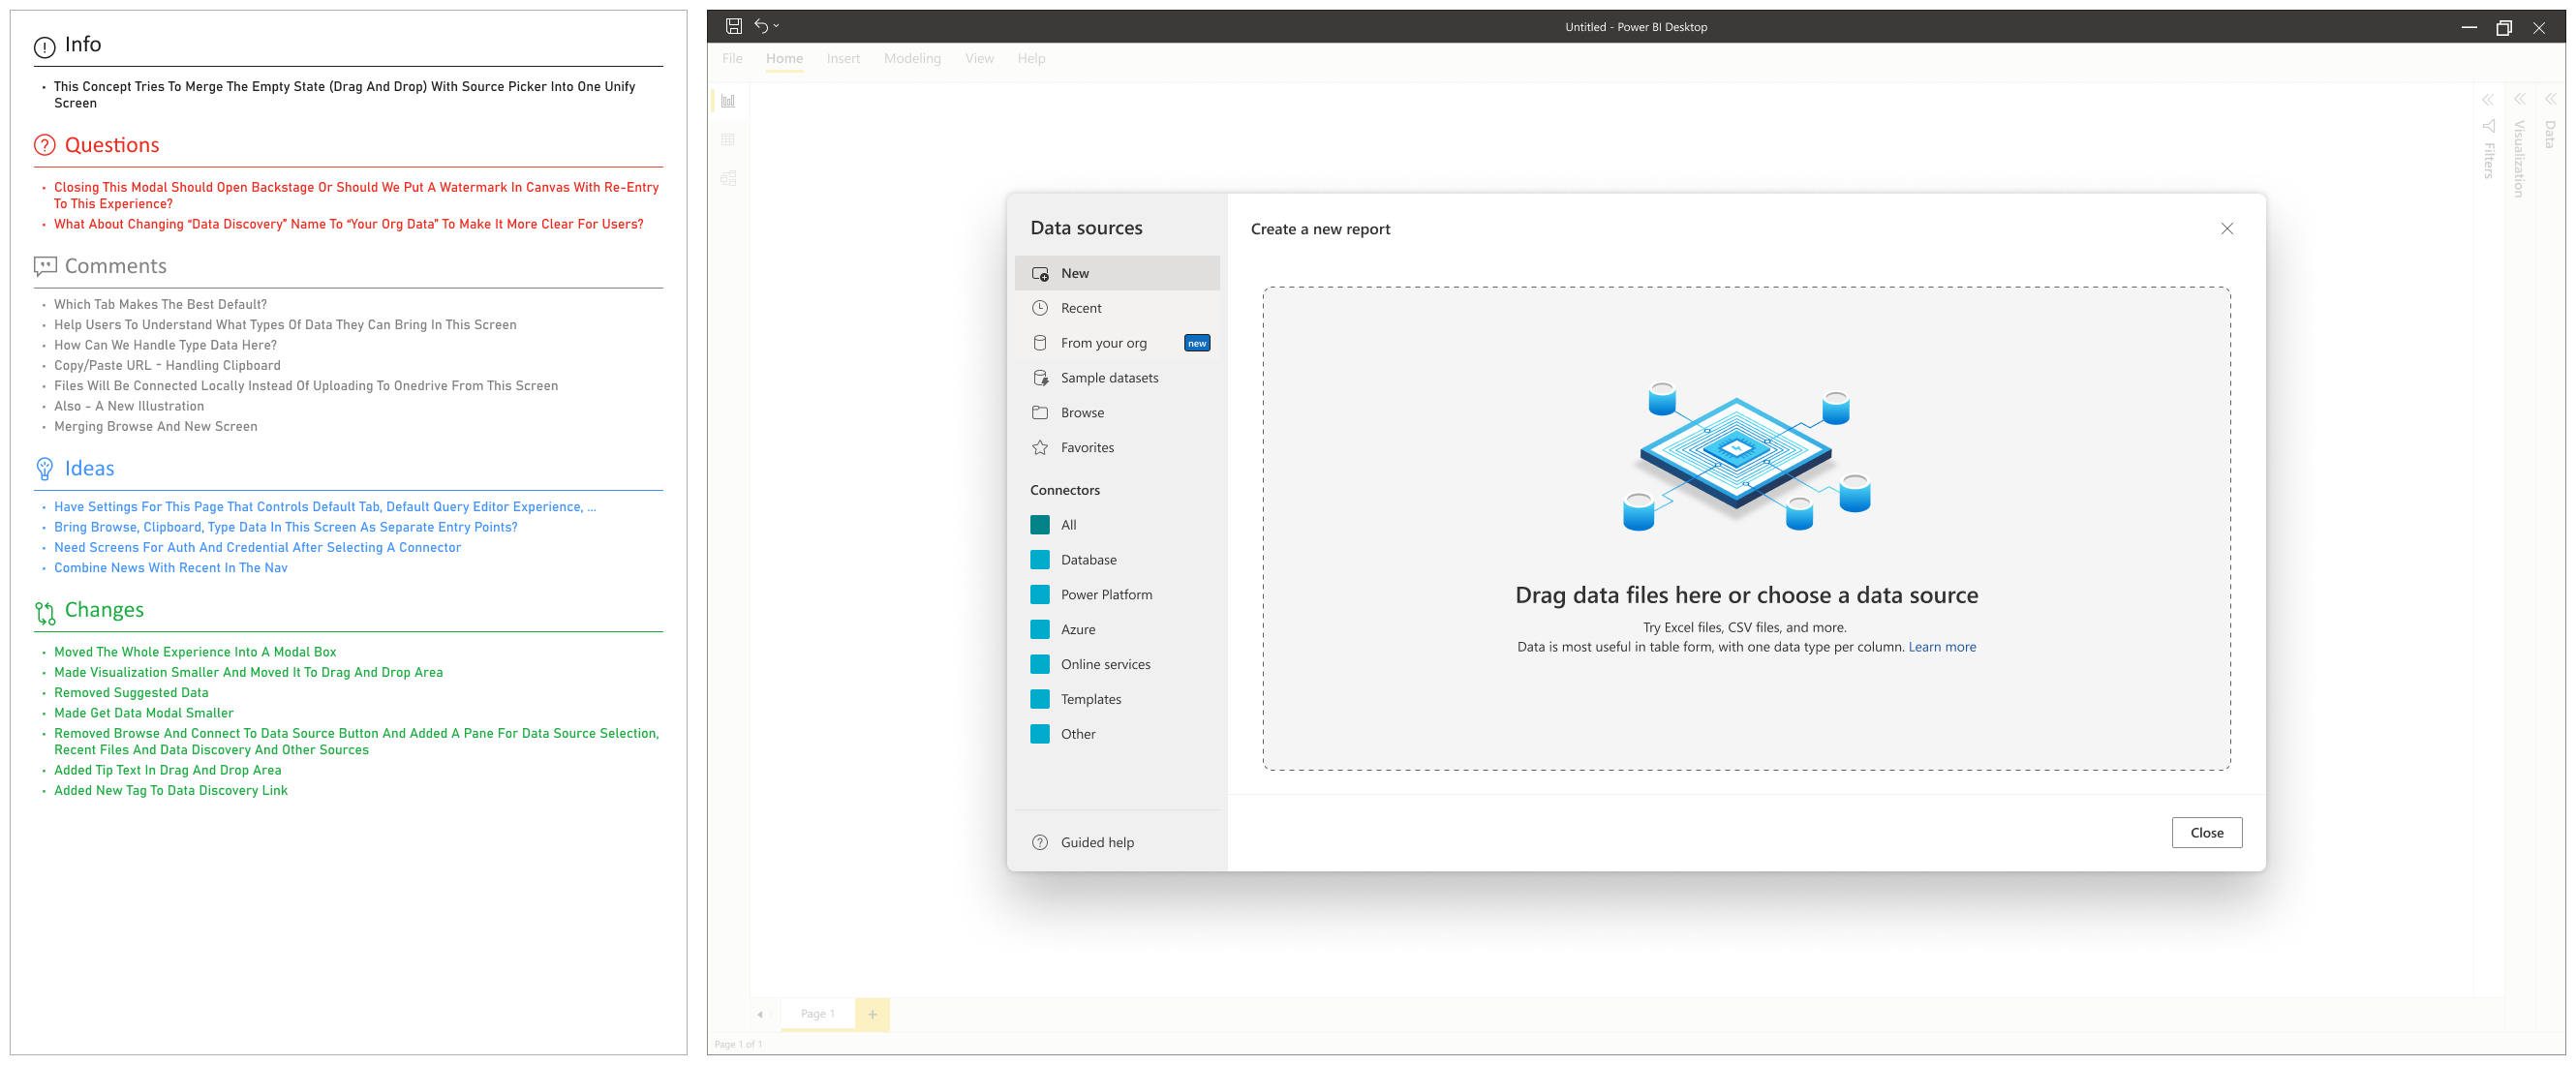
One of the other issues that we found in early concepts was using whole canvas as an entry point for get data, in Power BI users can bring more data after they created reports with initial data so in this case we can't use the canvas for get data experience since it's been using for reports and visuals.
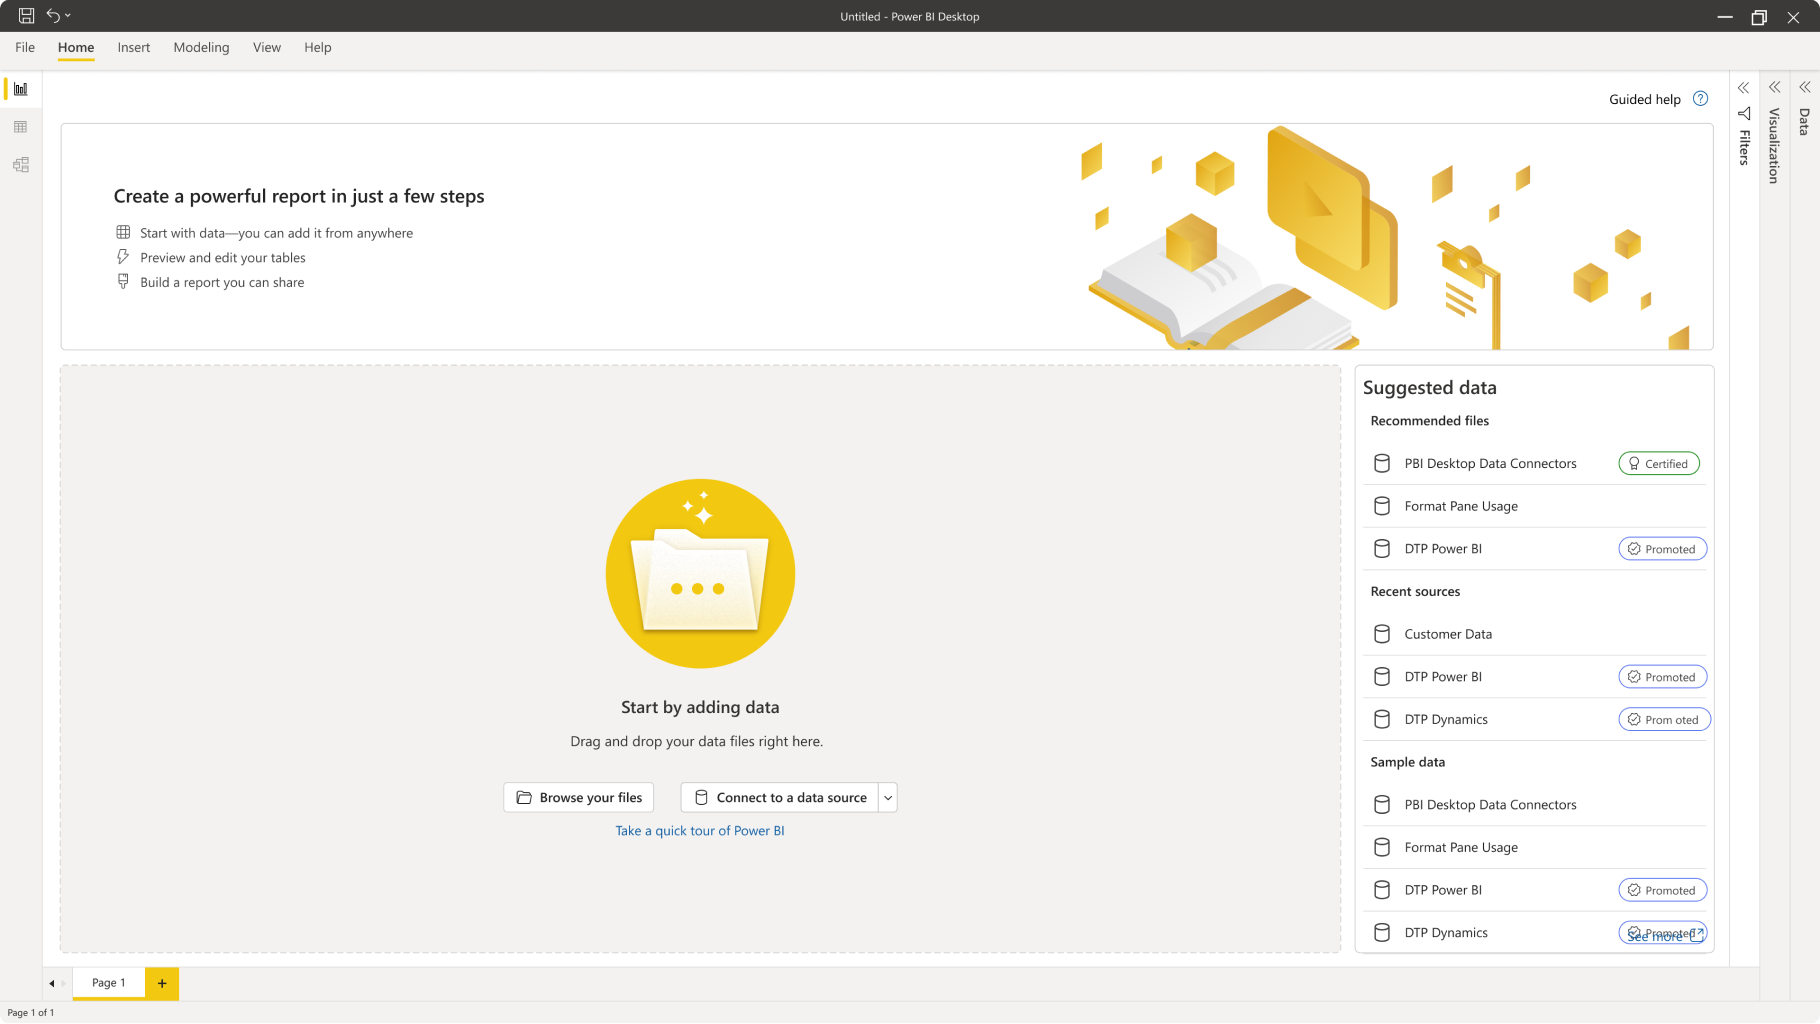
To mitigate this issue I tried the modal experience approach in this concept:

Next step is to use a proper data source
Since I knew that selecting between 150 different connectors for users is going to be a challenging task, I brought up this idea of letting user drag/drop their data into our application and we on the background choose the right steps depending on the file and data and guide users through next steps.
There were many advantages doing this way:
After they dropped their data then we can show the proper next steps and if there is an any issue we can guide them.
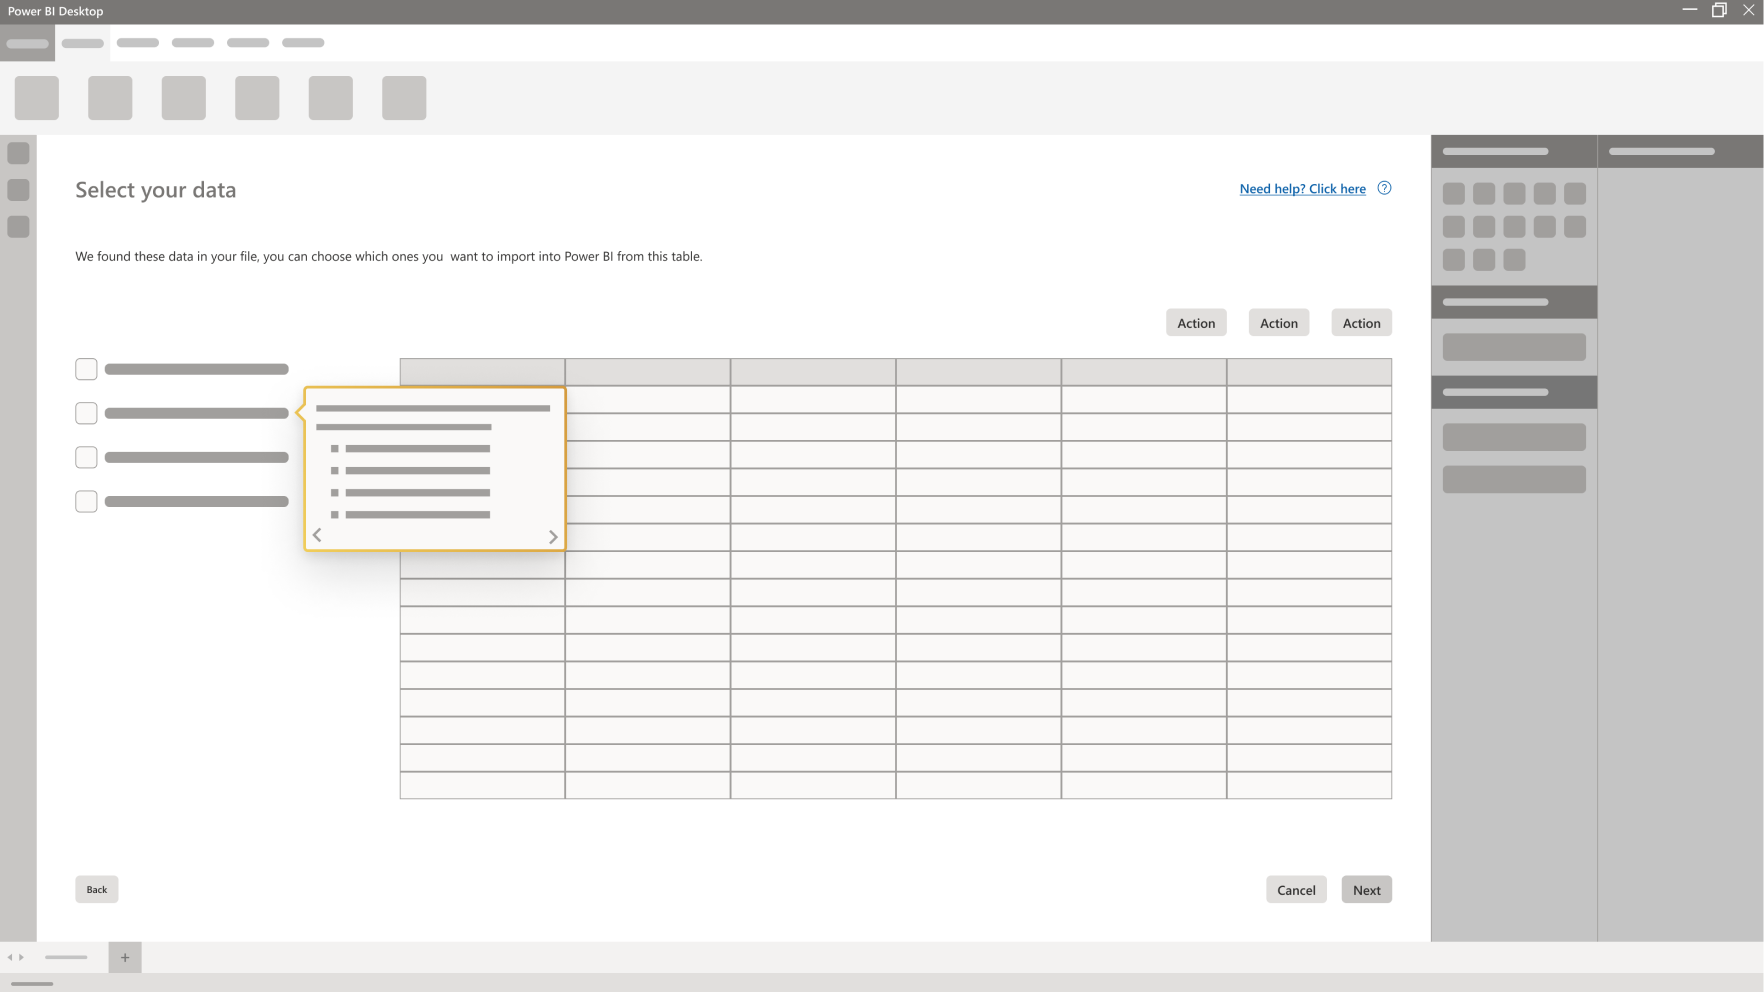
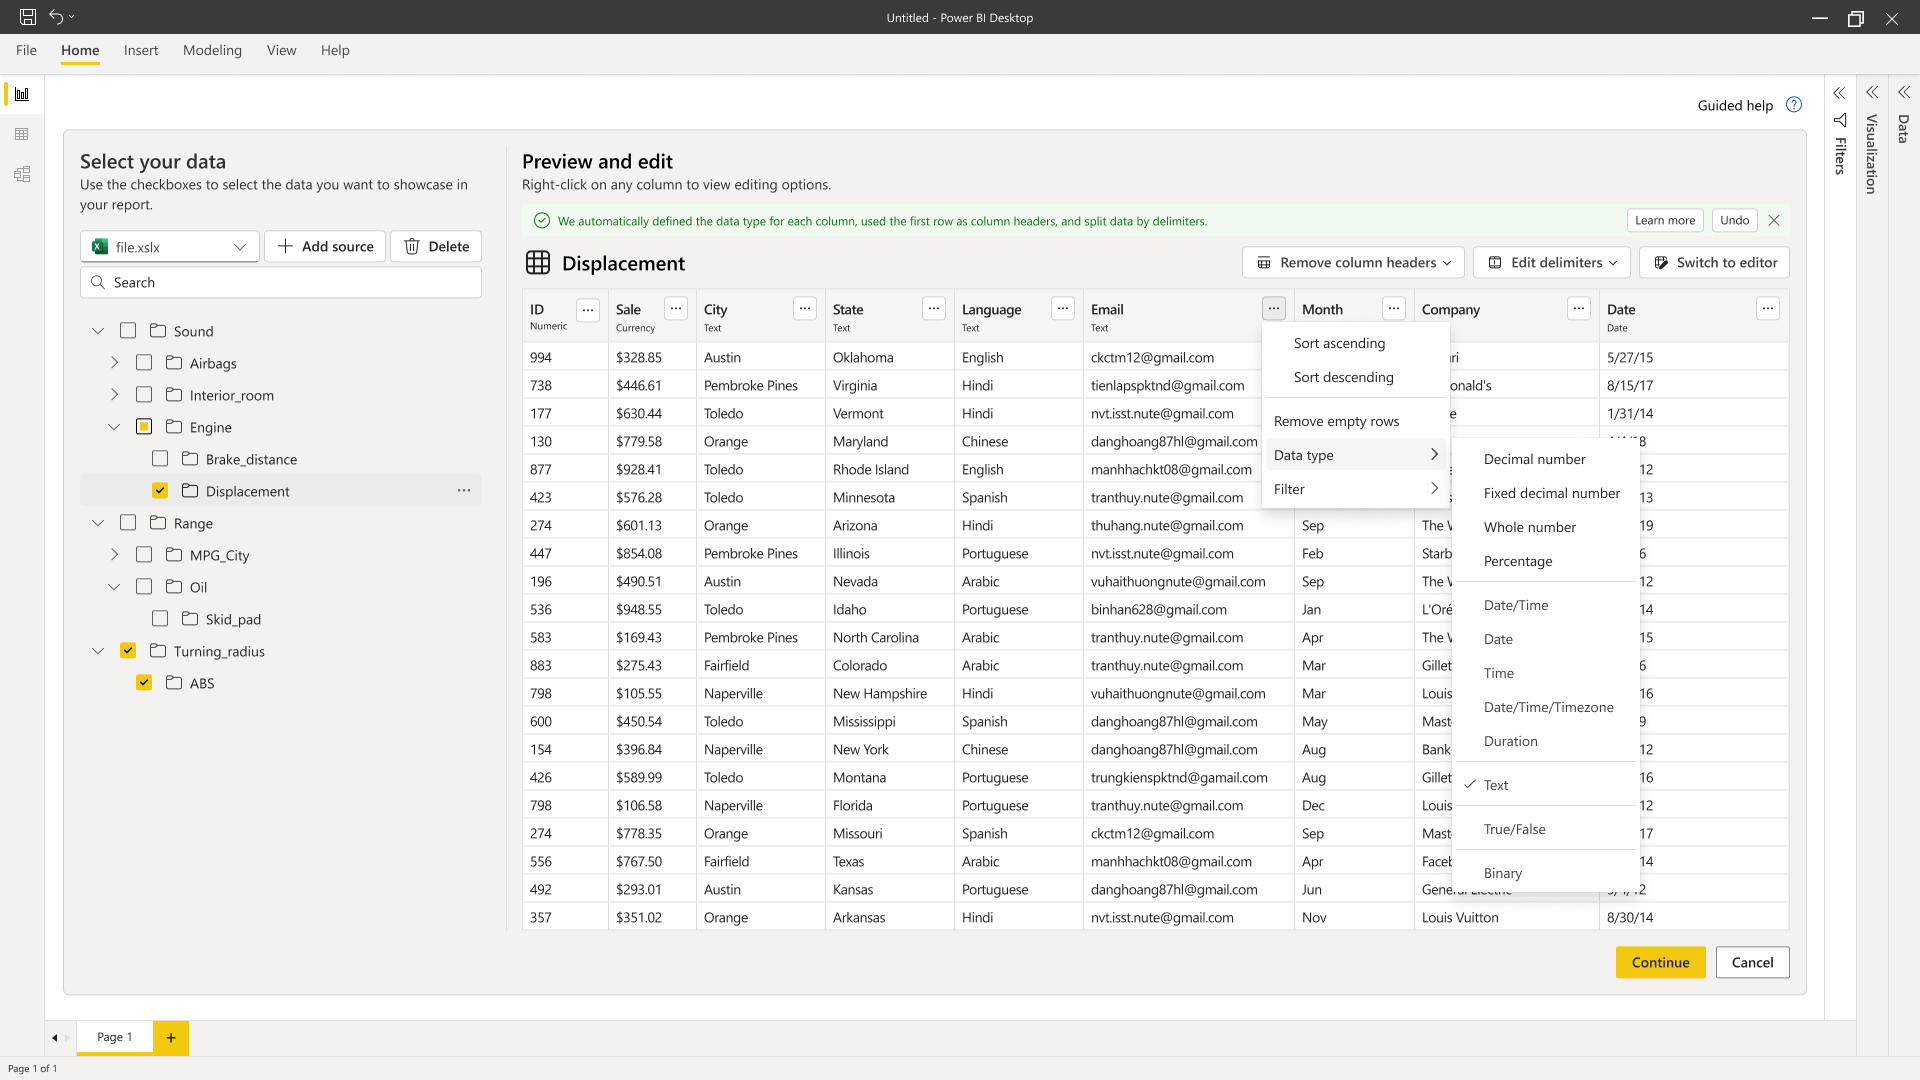
After successfully loaded their data, users can preview the data tables in this view.
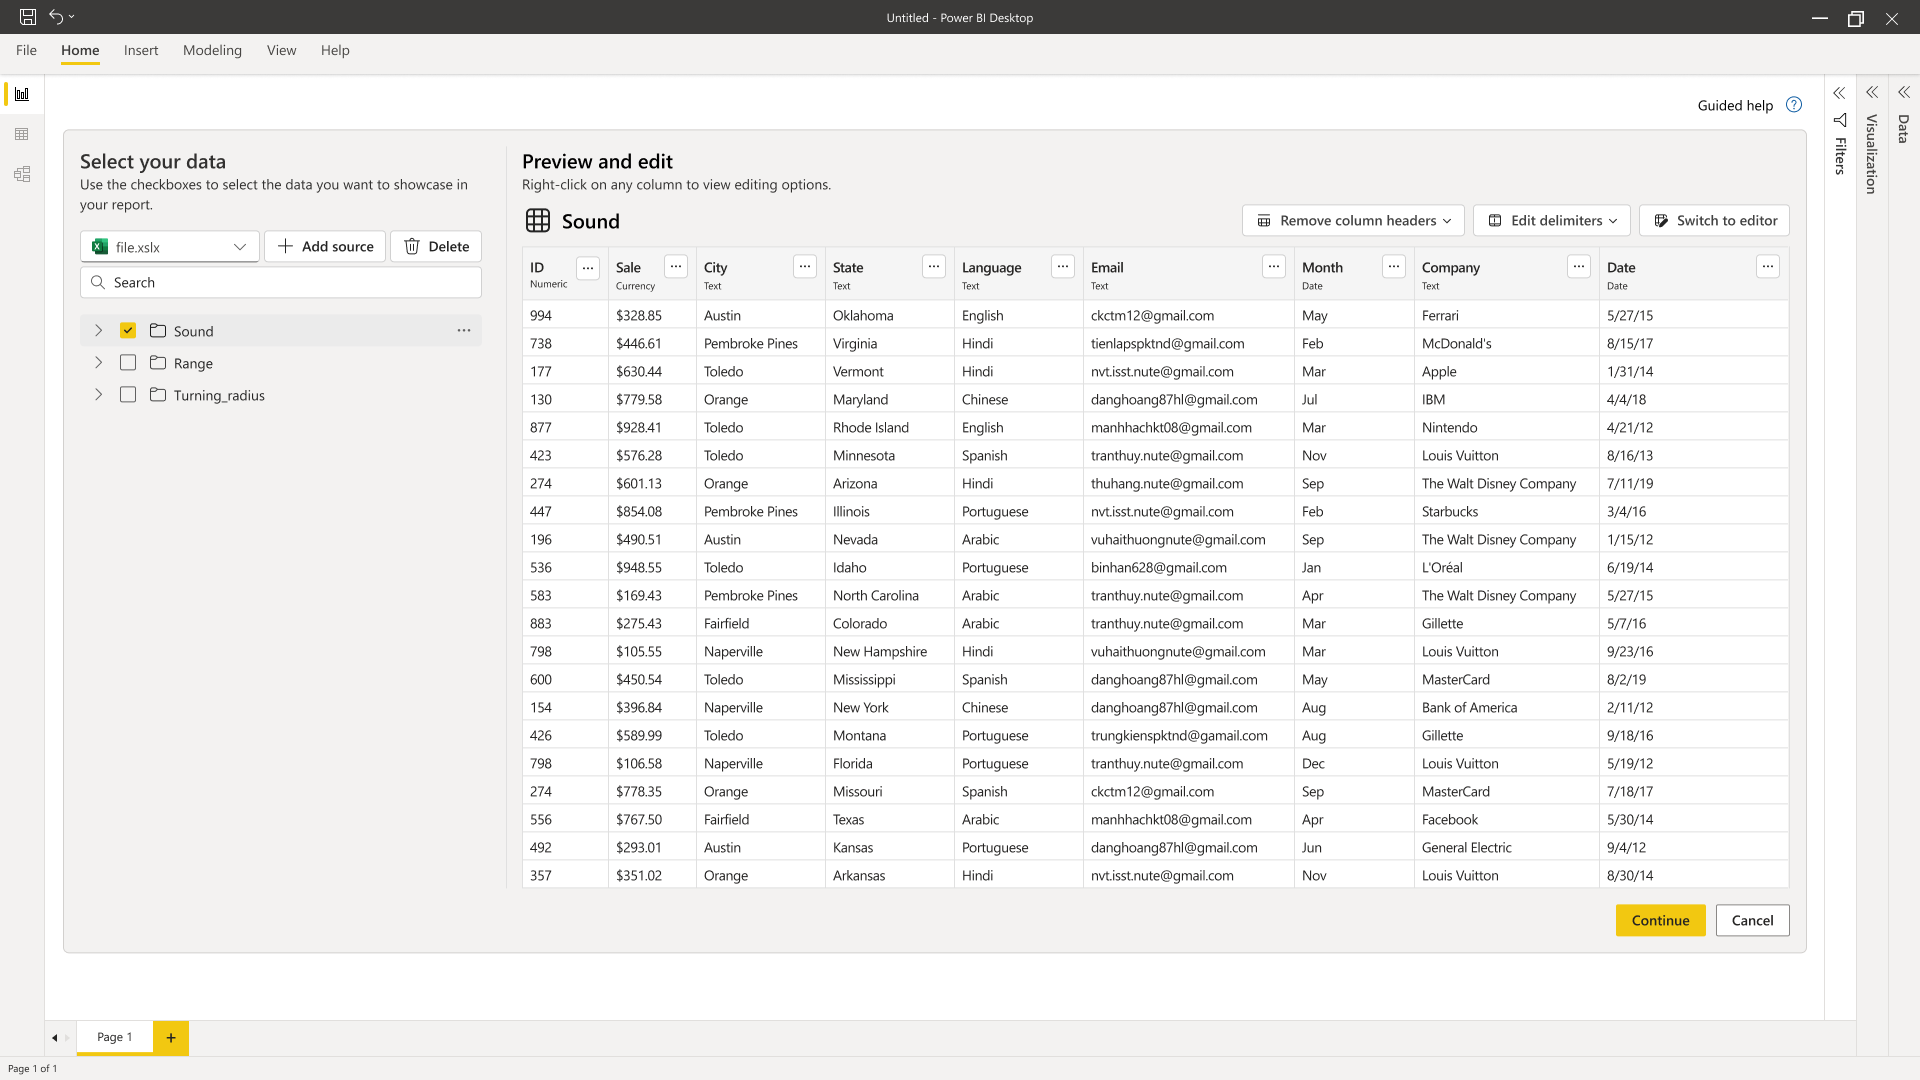
In these designs my goal was to make data prepping and cleaning easy specifically for new users. We conducted research and put some of the major cleaning tasks based on research results in this screen instead of floading it with complex actions.
As I mentioned before, one of major pain points from users perspective was lack of help and guidance during this process. In these concepts I tried to implement a contextual help in each step. Basically if users get stuck, they can easily click the help button and a step by step tour will guide them on the screen and help them finish the process.
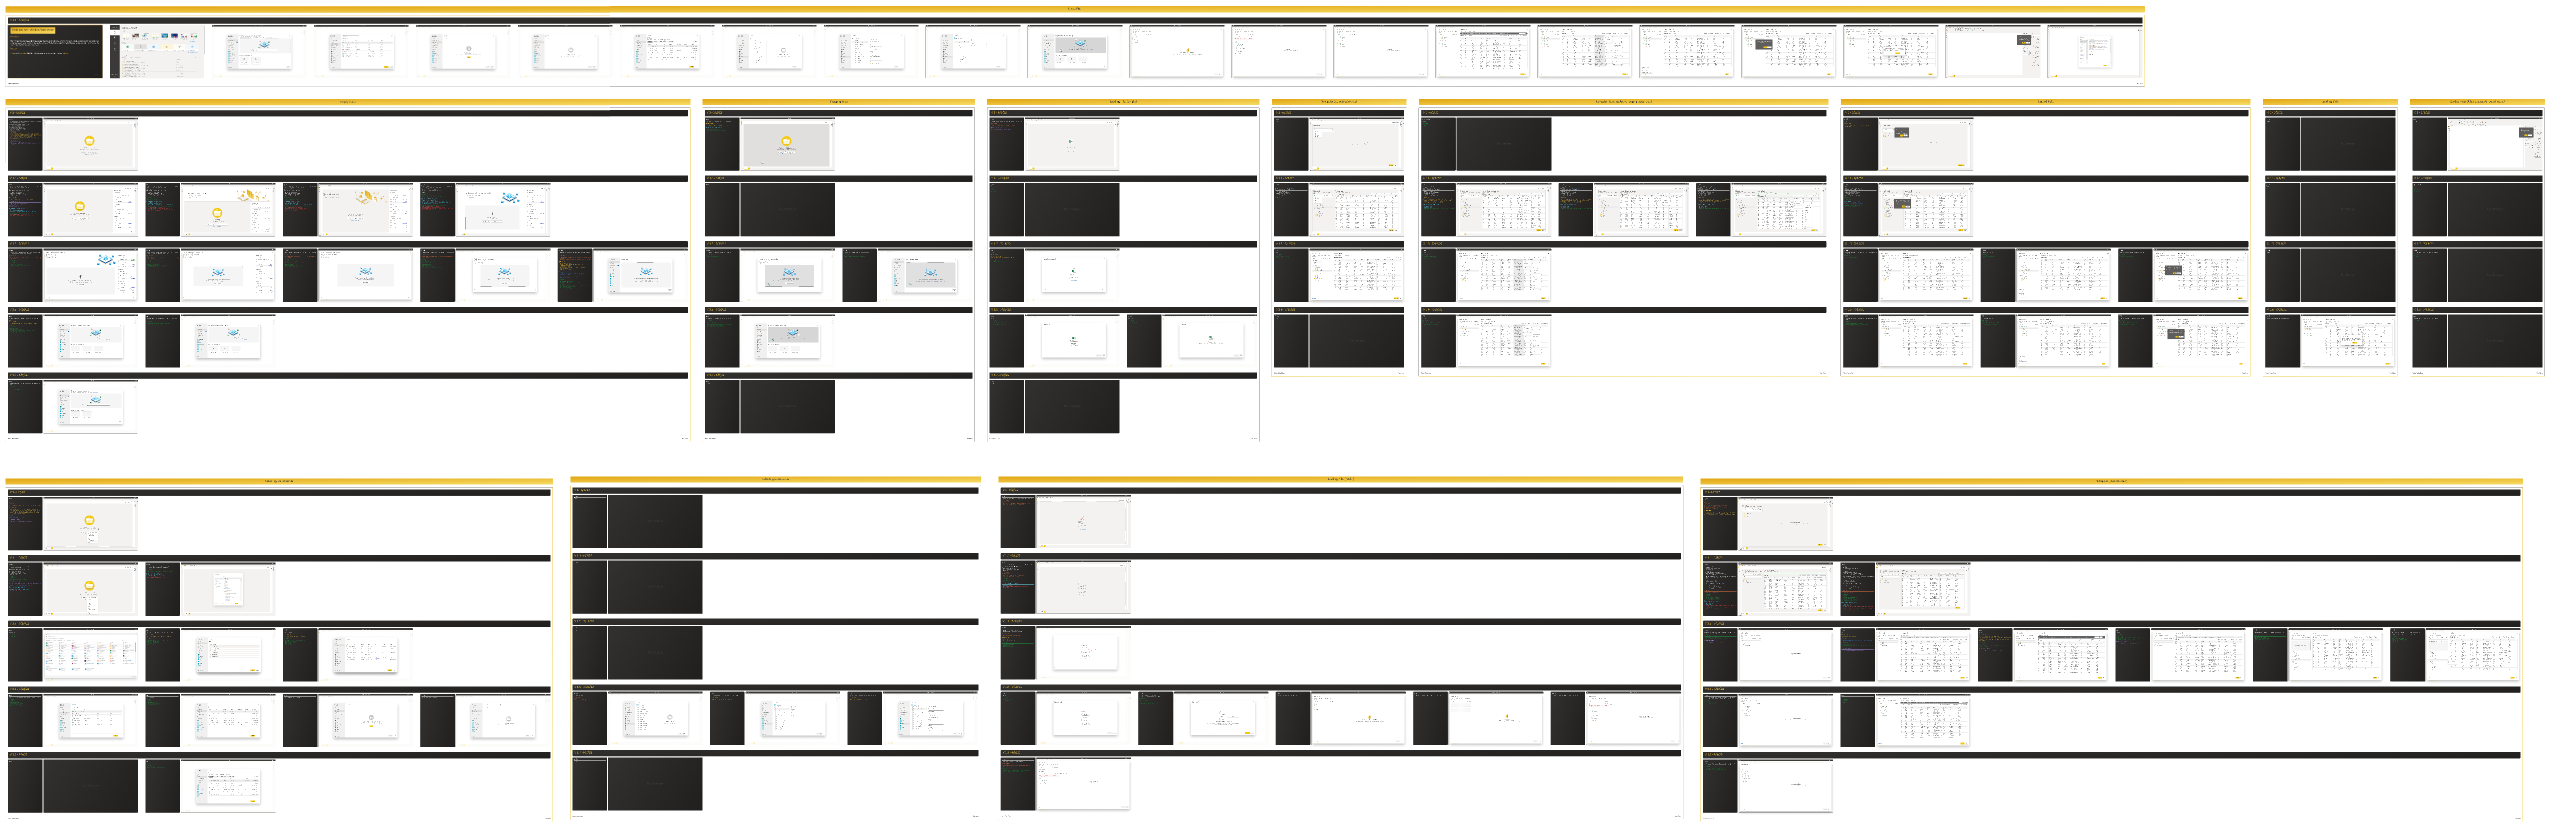
There were so many more iteration along the way by collaborating with internal teams and external users, as you can see in this zoomed out image of how we progressed till reached to this point.
Here are most recent designs: